Ask a general-purpose AI assistant to analyse a hedge fund and you will get a fluent answer in seconds. Ask where the Sharpe ratio came from and the answer is often less comfortable.
Language models are very good at writing and unreliable at arithmetic on data they cannot see. For a fund selector that is the whole problem, because the value of an analysis sits in the numbers. A confident paragraph built on a figure the model half remembered is worse than no paragraph at all.
Most allocation teams are already using AI in some form. The question that matters now is not whether analysts will ask an assistant about funds. It is whether the figures that come back can be traced to data you already trust.
The assistant asks. The engine answers.
The approach we have taken is simple to describe. Through the Model Context Protocol, an AI assistant is connected to the AlternativeSoft analytics engine. When an analyst asks a question in plain language, the assistant does not estimate the answer. It requests the calculation, the engine computes it from the underlying return series, and the assistant writes up what came back.
The model does the language. The engine does the mathematics. Every figure in the example below was computed that way, and none was generated by the model.
What came back
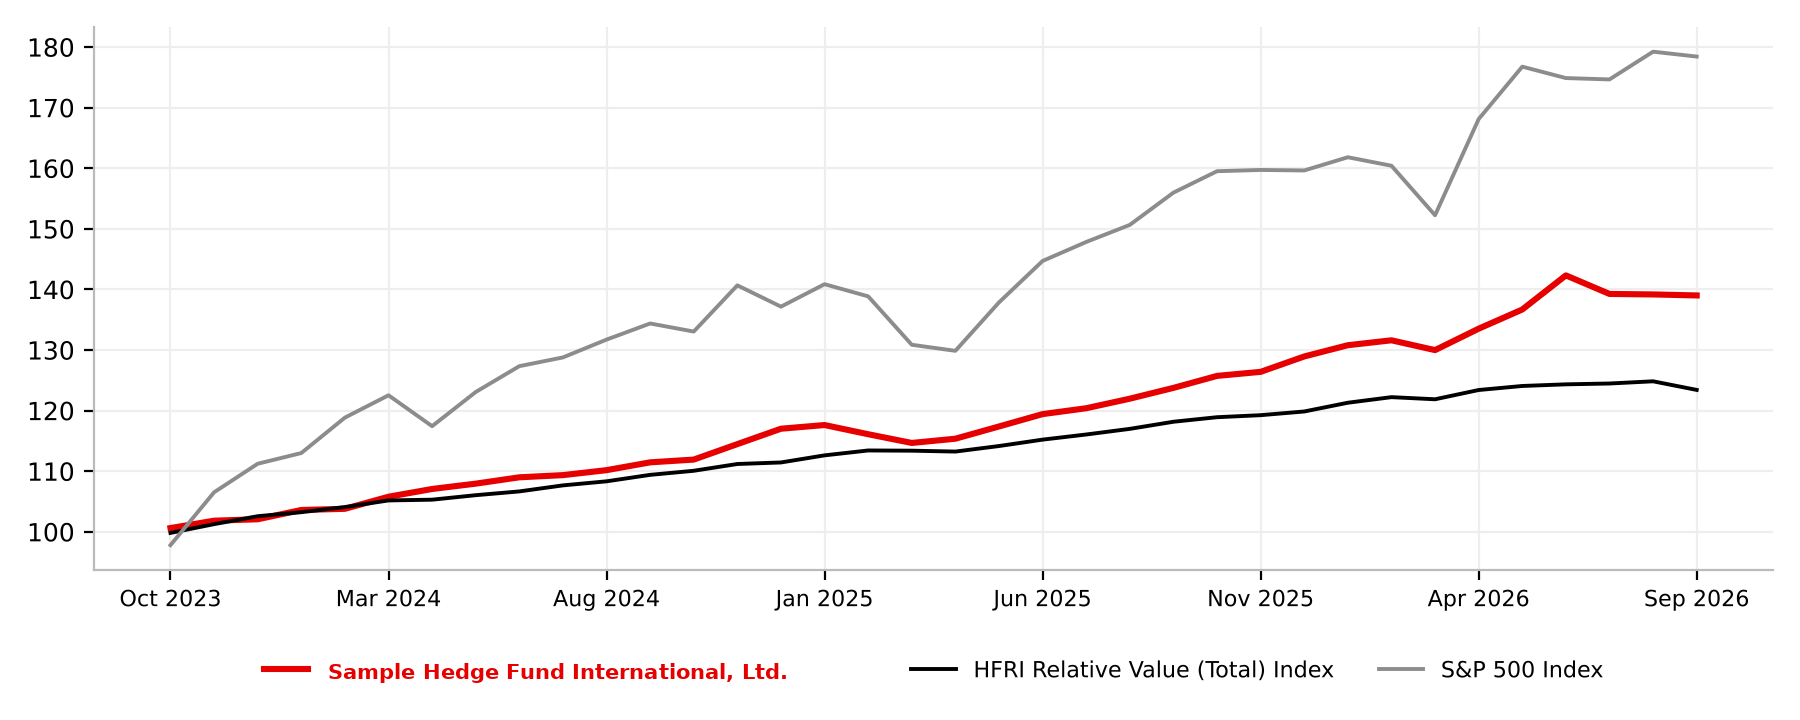
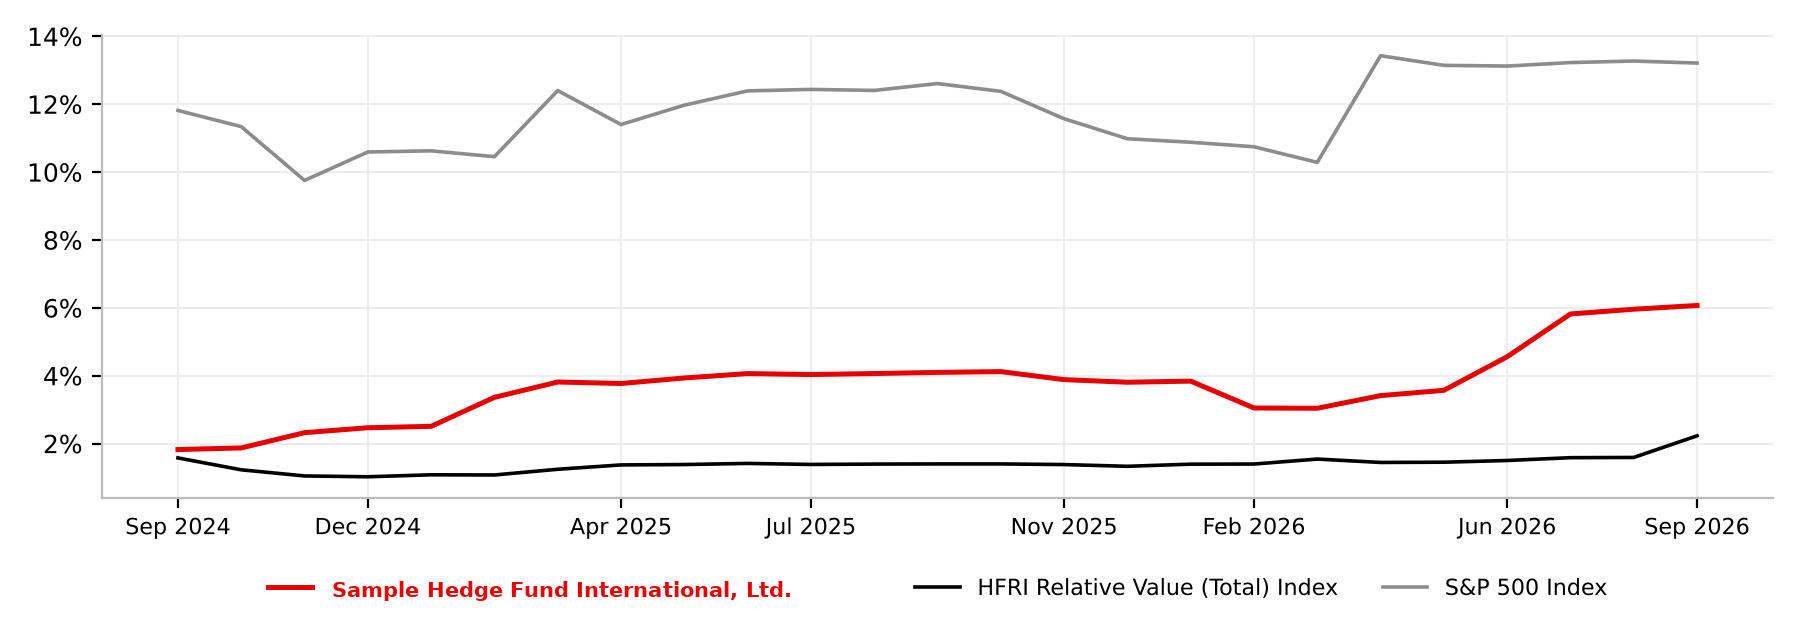
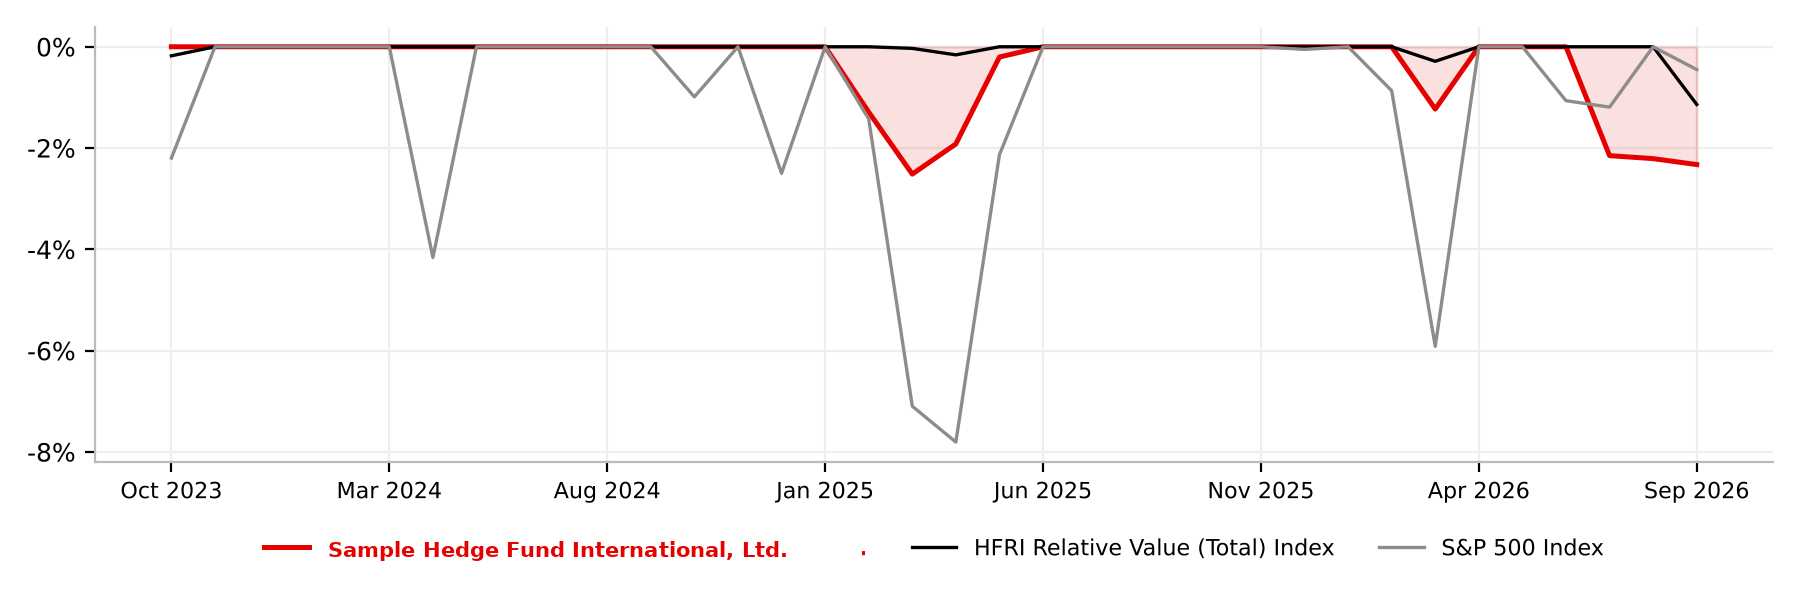
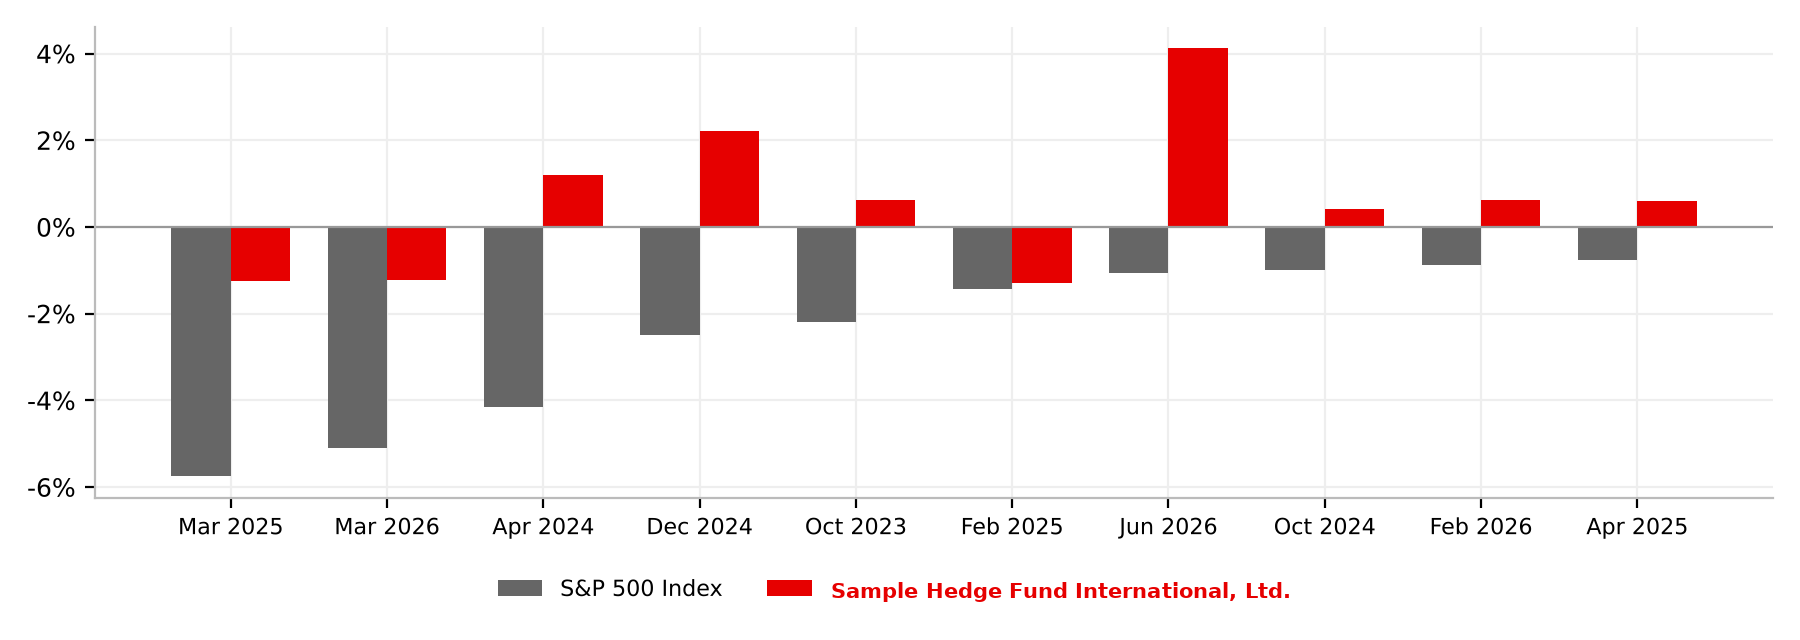
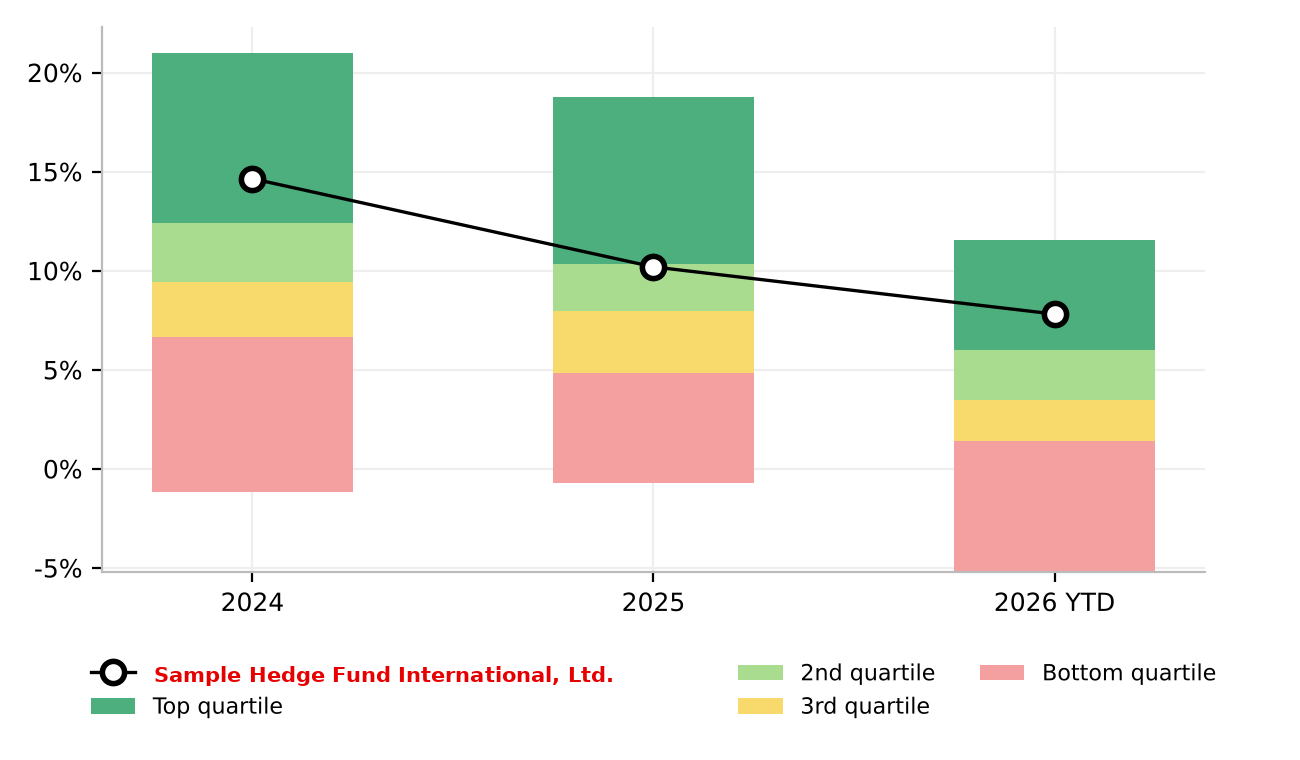
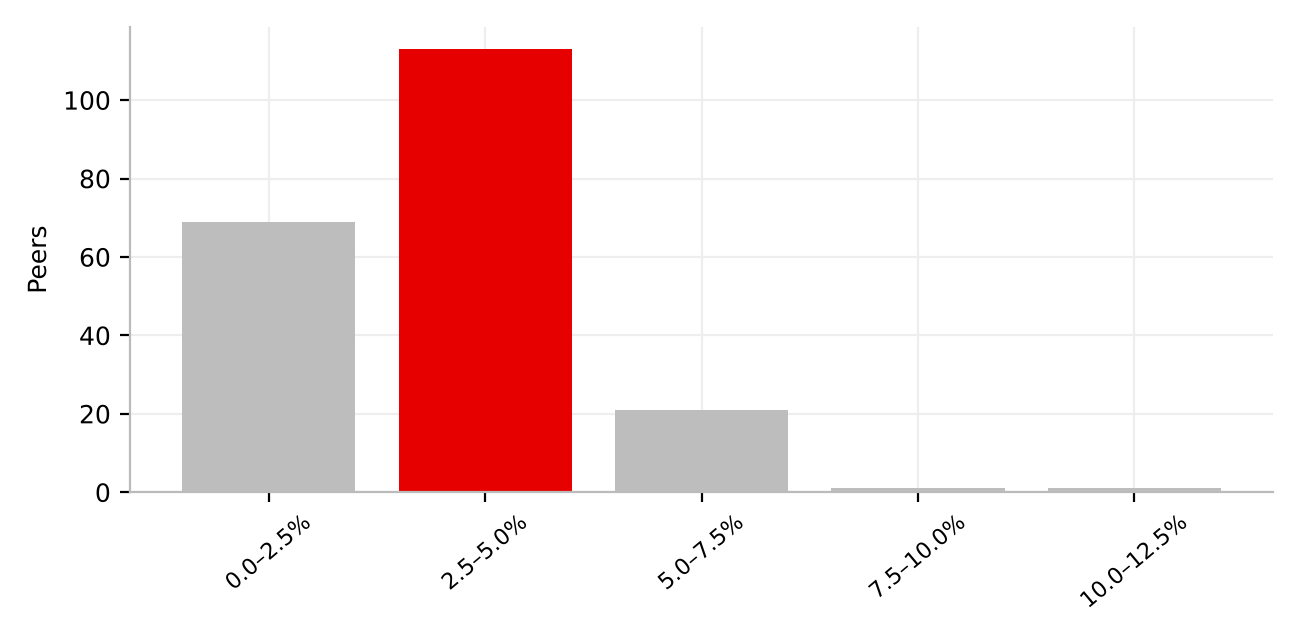
The headline numbers are strong. The fund returned 11.61% a year with 4.24% volatility, a Sharpe ratio of 1.68 at a 4.50% risk-free rate. Its maximum drawdown was 2.51% in March 2025, recovered by May 2025. Against the 207 funds in its peer group, its annualised return of 11.61% compared with a peer median of 8.03%, which put it in the top 20%.
The analysis did not stop at the headlines, and that is what separates a useful analysis from a summary.
The risk with AI in fund research is not that it cannot write. It is that it can write confidently about numbers it has never calculated. When the assistant asks and the engine answers, every figure can be traced back to data you already trust.
Laurent Favre, Chief Executive Officer, AlternativeSoftThree questions a good analysis answers
1. Compared with what?
A return on its own says very little. The same 11.61% means something different against a peer median of 8.03% than it does against a benchmark that returned 21.29%. Peer ranking supplies the context, but only if you know how the peer group was built.
We ran a second example on a large French flexible allocation UCITS fund against 318 French-domiciled peers. The report showed where the fund stood out: in 2020 it returned 12.4% against a peer median of 1.3%, ahead of 90% of its peers. It also showed where it did not. Its annualised return of 3.3% and Sharpe ratio of 0.05 sat below the peer medians of 4.3% and 0.12. The report itself warned that the peer group mixes money market, bond, equity and flexible allocation funds, and that the results should be read with care. A good analysis tells you where a fund does not stand out as plainly as where it does.
2. What is driving the return?
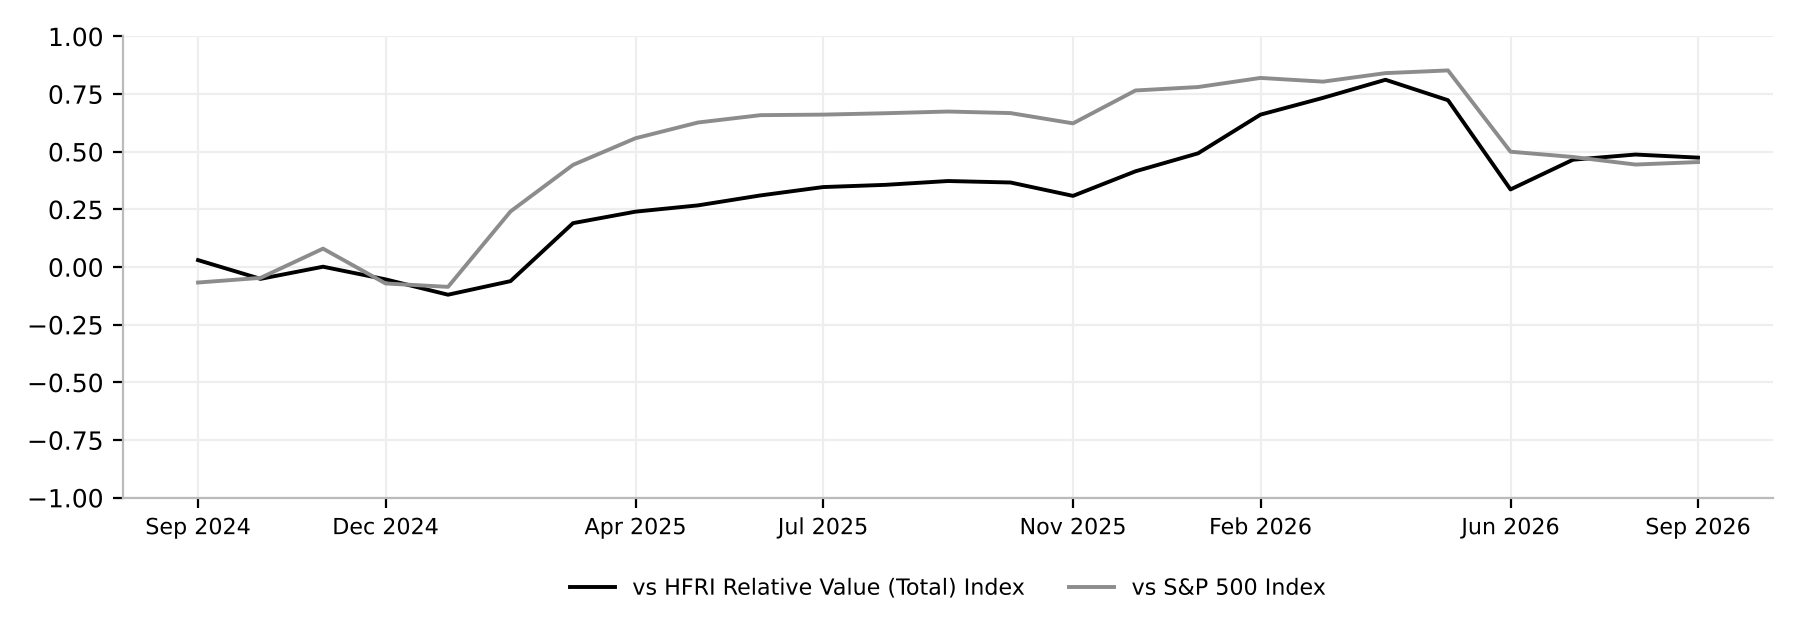
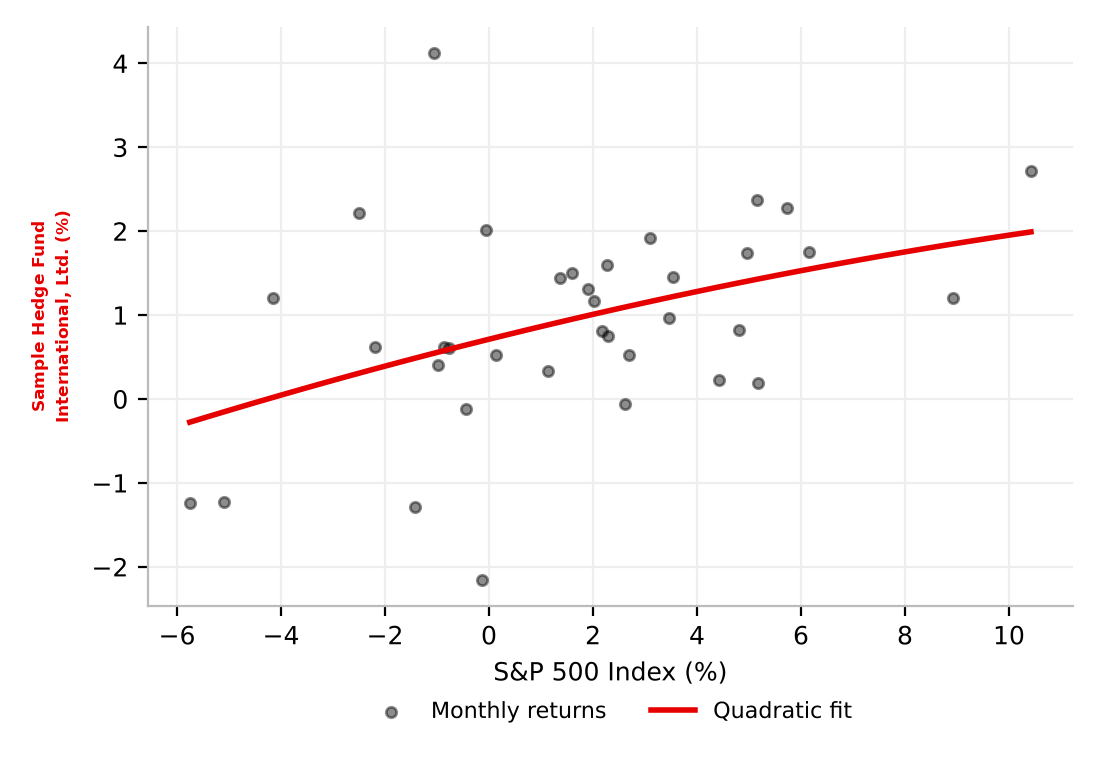
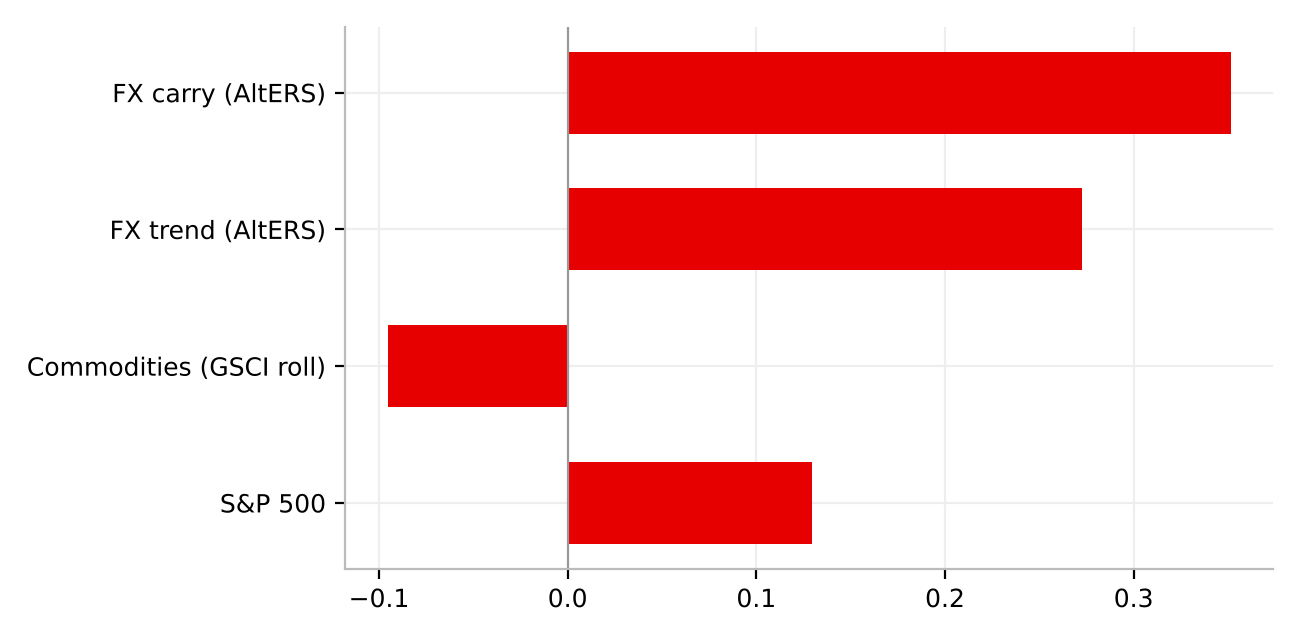
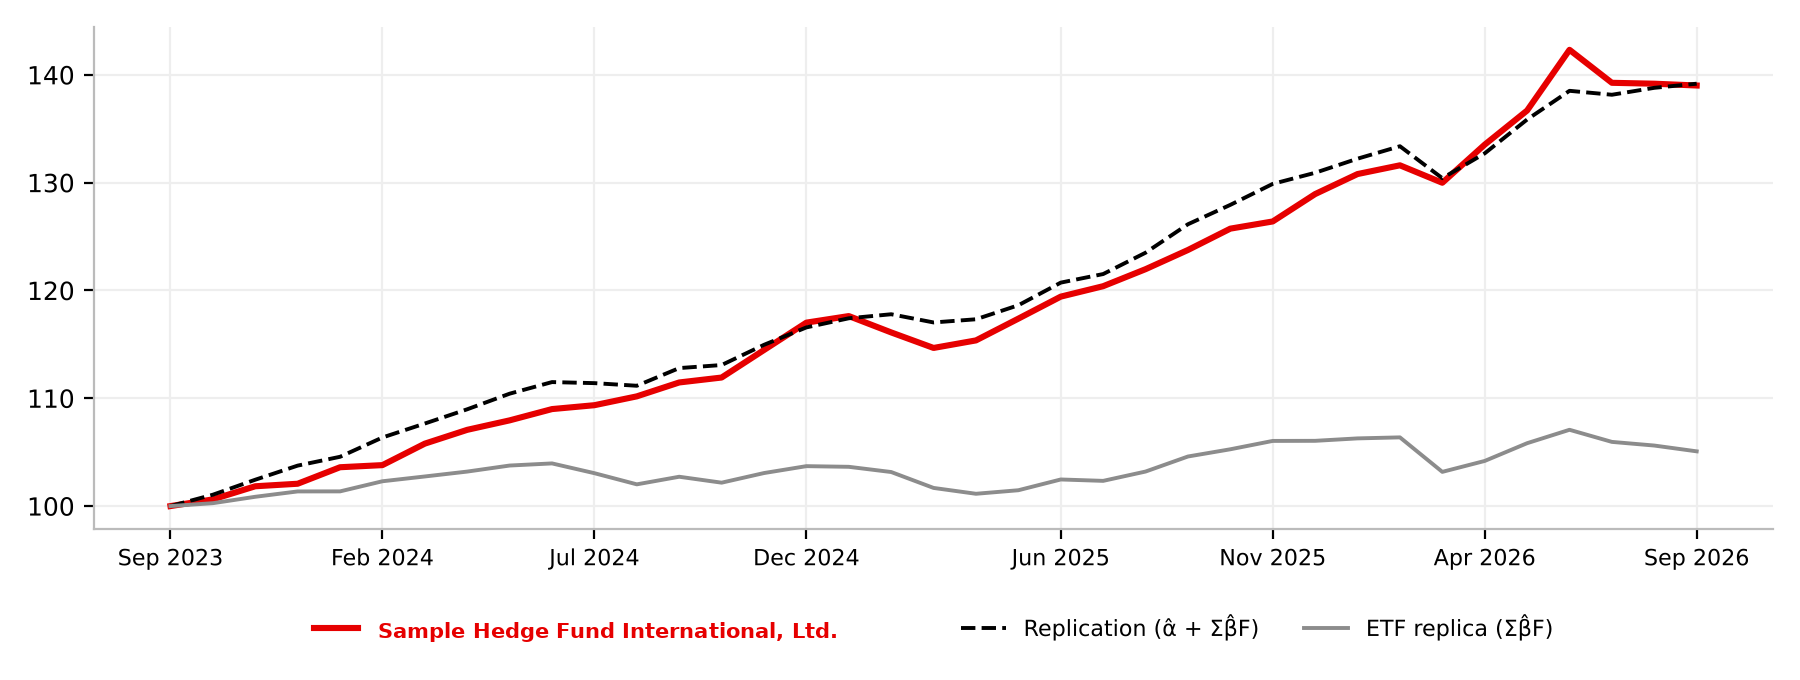
For the hedge fund, a two-step Lasso factor replication on 36 monthly observations found annual alpha of 9.42% with a t-statistic of 4.30. Factor exposures, such as FX carry, FX trend, commodities and equity beta, explained only 1.66% of the 11.61% return. The rest was not explained by the factors.
That is a strong result, and the sample is short. Thirty-six observations against sixteen candidate factors is a thin base, and a careful analyst should say so. The report does.
3. What does it cost, and is the data complete?
Estimated total fees were 2.90% a year, below the peer median of 3.19%, and the alpha covered them 3.25 times. Yet the performance fee collected, 2.90% against a peer median of 1.81%, ranked 167th of 206 funds when ordered from cheapest.
This is where the one caution sat. Only the 20% performance fee is recorded for the fund, so the fee estimate leaves out any management fee or pass-through costs. The fund has also lost 2.3% since July 2026 and remained below its June peak at the end of September. A fluent summary could have buried either point. The report put both in plain sight.
How to judge any AI-generated fund analysis
Whether or not you use our engine, four checks apply to any analysis an assistant produces for you.
- Trace every number. If nobody can say which calculation on which data produced a figure, treat it as unverified.
- Insist on the caution. An analysis that finds nothing to worry about has probably not looked hard enough.
- Check the sample and the peer group. A top-20% rank means little without knowing how many funds, which funds and over what window.
- Separate return from skill, and skill from fees. Alpha after factors, and fees measured against it, tell you more than any headline return.
From a sample fund to yours
The example above is anonymised, but the method is not specific to it. The same engine and the same connection can analyse any fund in your universe, from a plain-English question. Below is the full interactive factsheet from the test. Open it, filter it and judge the depth for yourself, then tell us which of your funds you would like to see analysed.
Source: AlternativeSoft analysis. Data from the AlternativeSoft analytics connector, 36 months to 30 September 2026. Benchmarks: HFRI Relative Value (Total) Index and S&P 500 Index. Peer groups: 207 constituents of the HFRI Relative Value (Total) Index; 318 French-domiciled UCITS funds with AUM above $500m. The hedge fund is anonymised. For professional and qualified investors only. This article is for information and is not investment advice. Past performance is not a reliable indicator of future results.