
Performance, risk, peer ranking, factor alpha, fees and a plain-English verdict on one anonymised multi-strategy hedge fund. Every figure is computed from data returned by the AlternativeSoft analytics engine.
USD · Cayman Islands · Multi-strategy relative value and arbitrage. Period Oct 2023 to Sep 2026 (36 months). Risk-free rate 4.50%.
The report closes with a balanced read of the evidence: three strengths and one caution.
A softer patch and incomplete fee data. The fund has lost 2.3% since July 2026 and is still below its June peak. Only the 20% performance fee is recorded, so the estimated 2.9% a year in fees leaves out any management fee or pass-through expenses. Minimum and subscription terms are not recorded, and redemptions are quarterly.
The fund against two benchmarks over the same 36 months. Switch benchmark columns on or off to focus the comparison.
| Metric | Sample Hedge Fund International, Ltd. | HFRI Relative Value (Total) Index | S&P 500 Index |
|---|---|---|---|
| Annualized return | 11.61% | 7.27% | 21.29% |
| Annualized volatility | 4.24% | 1.82% | 12.38% |
| Skewness | -0.21 | -1.04 | 0.13 |
| Excess kurtosis | 0.80 | 1.57 | 0.06 |
| Annual Sharpe ratio (Rf 4.50%) | 1.68 | 1.52 | 1.36 |
| Sortino ratio (MAR 4.50%) | 3.20 | 2.51 | 2.72 |
| Correlation to Benchmark 1 | 0.34 | 1.00 | 0.69 |
| Beta to Benchmark 1 | 0.80 | 1.00 | 4.69 |
| Annualized tracking error vs Benchmark 1 | 3.99% | 0.00% | 11.21% |
| Max monthly loss | -2.15% | -1.14% | -5.75% |
| Normal monthly VaR 99% | -1.92% | -0.63% | -6.63% |
| Modified monthly VaR 99% (Cornish-Fisher) | -2.32% | -1.01% | -6.31% |
| Conditional monthly VaR 99% (historical) | -2.15% | -1.14% | -5.75% |
| Max drawdown | -2.51% | -1.14% | -7.81% |
| Date of max drawdown | Mar 2025 | Sep 2026 | Apr 2025 |
| Max time under water (months) | 4 | 2 | 4 |
All figures are computed from monthly returns returned by the AlternativeSoft connector. Benchmark 1's own correlation, beta and tracking error read 1.000, 1.000 and 0.00% by construction. The date of max drawdown is the trough month.
| Series | 2023 (Oct to Dec) | 2024 | 2025 | 2026 YTD |
|---|---|---|---|---|
| Sample Hedge Fund International, Ltd. | 2.1% | 14.6% | 10.2% | 7.8% |
| HFRI Relative Value (Total) Index | 2.6% | 8.6% | 7.5% | 3.0% |
| S&P 500 Index | 11.2% | 23.3% | 16.4% | 11.8% |
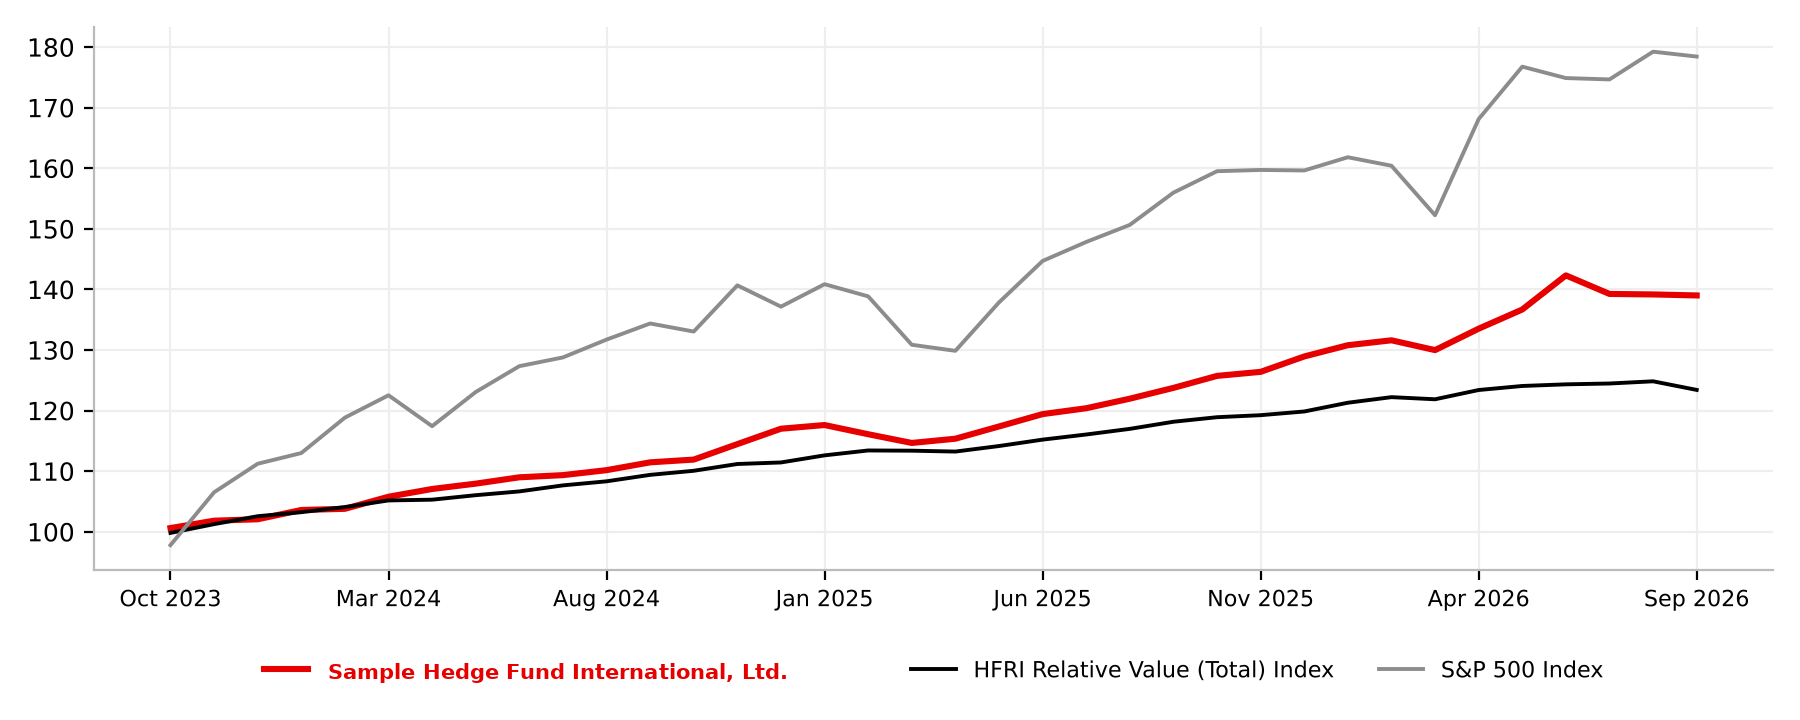
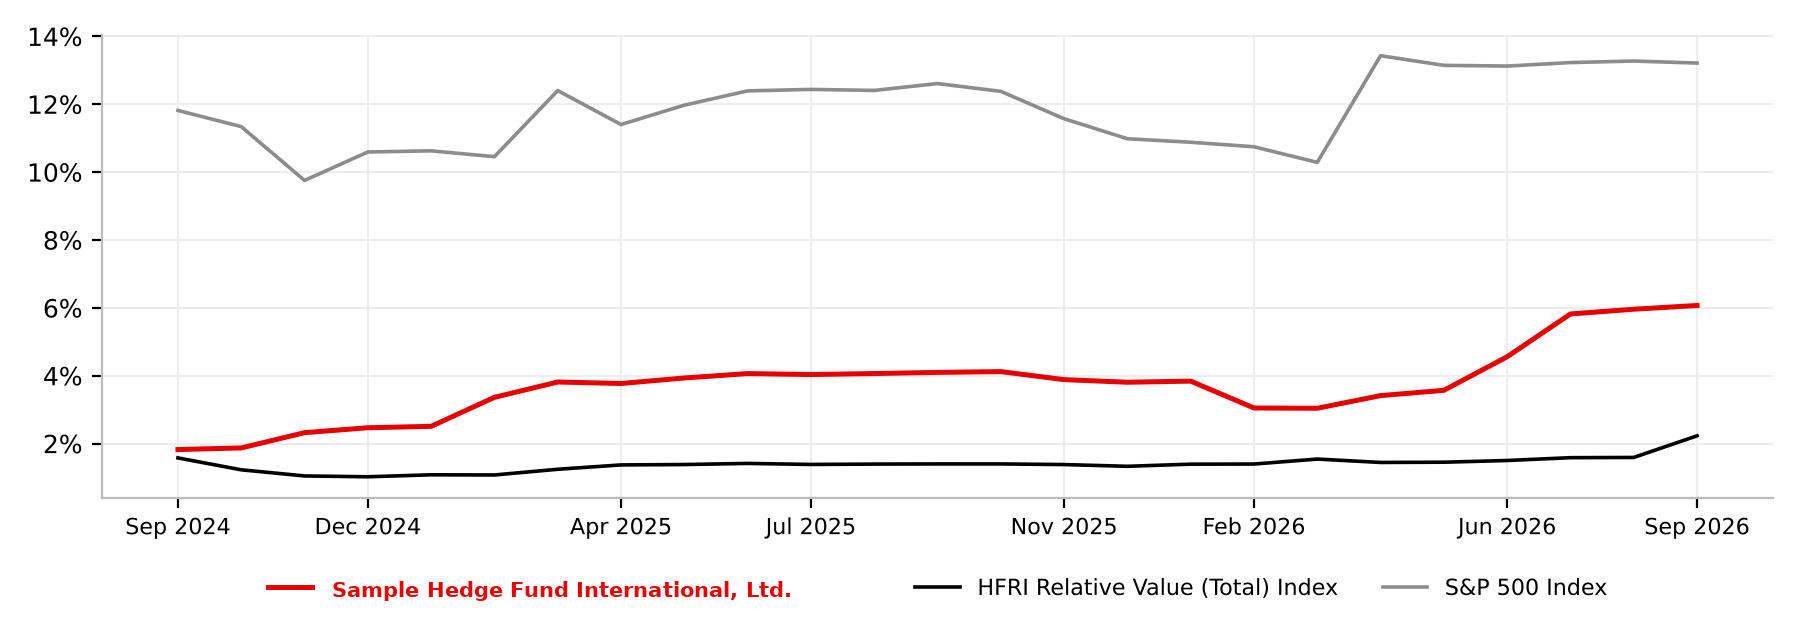
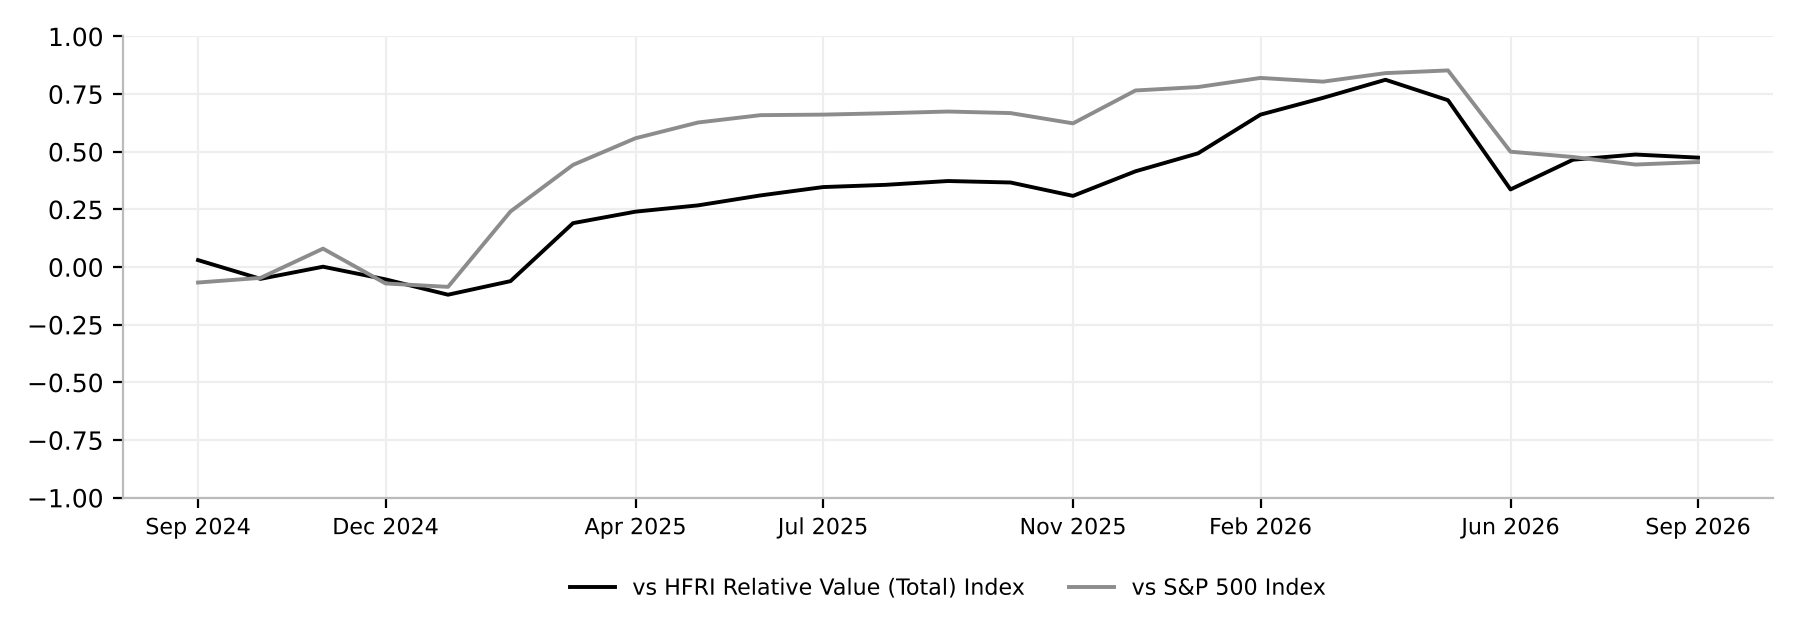
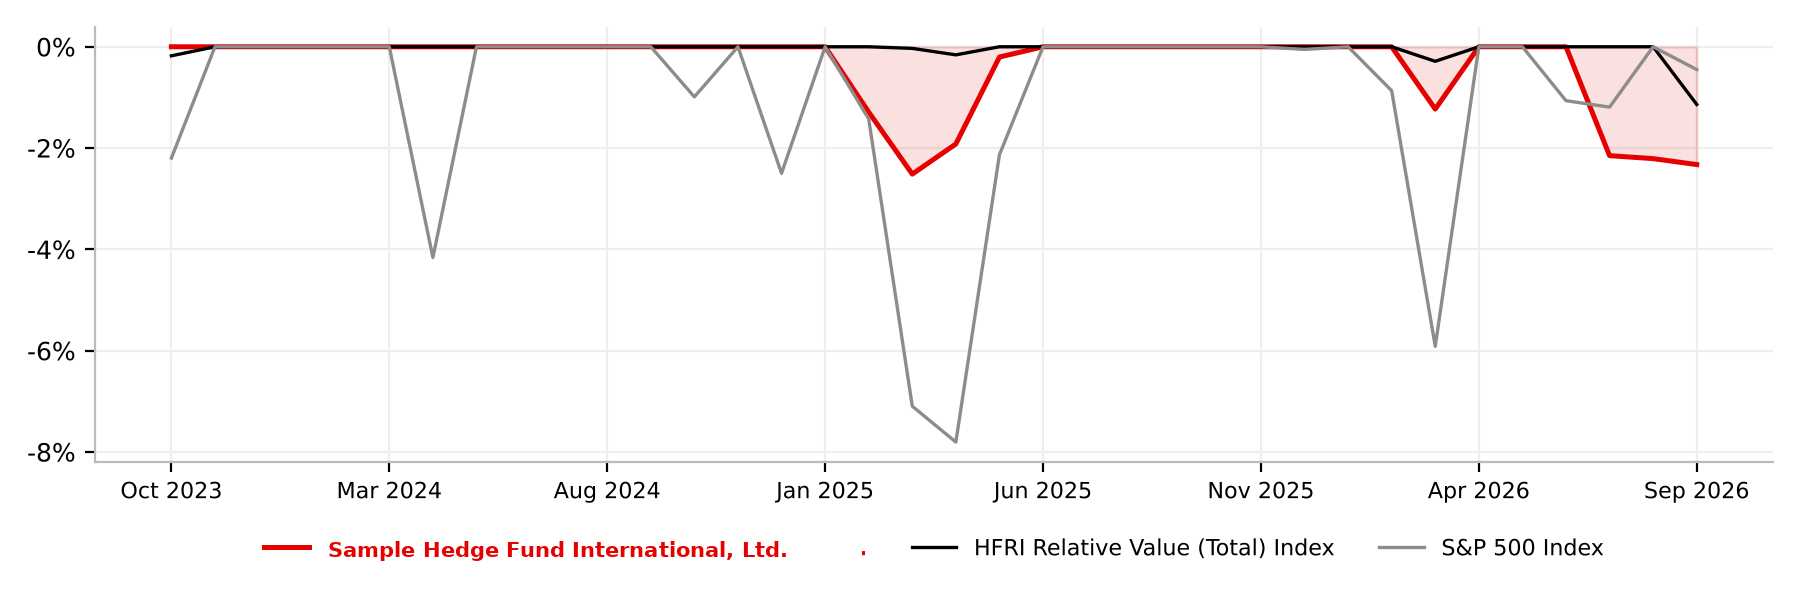
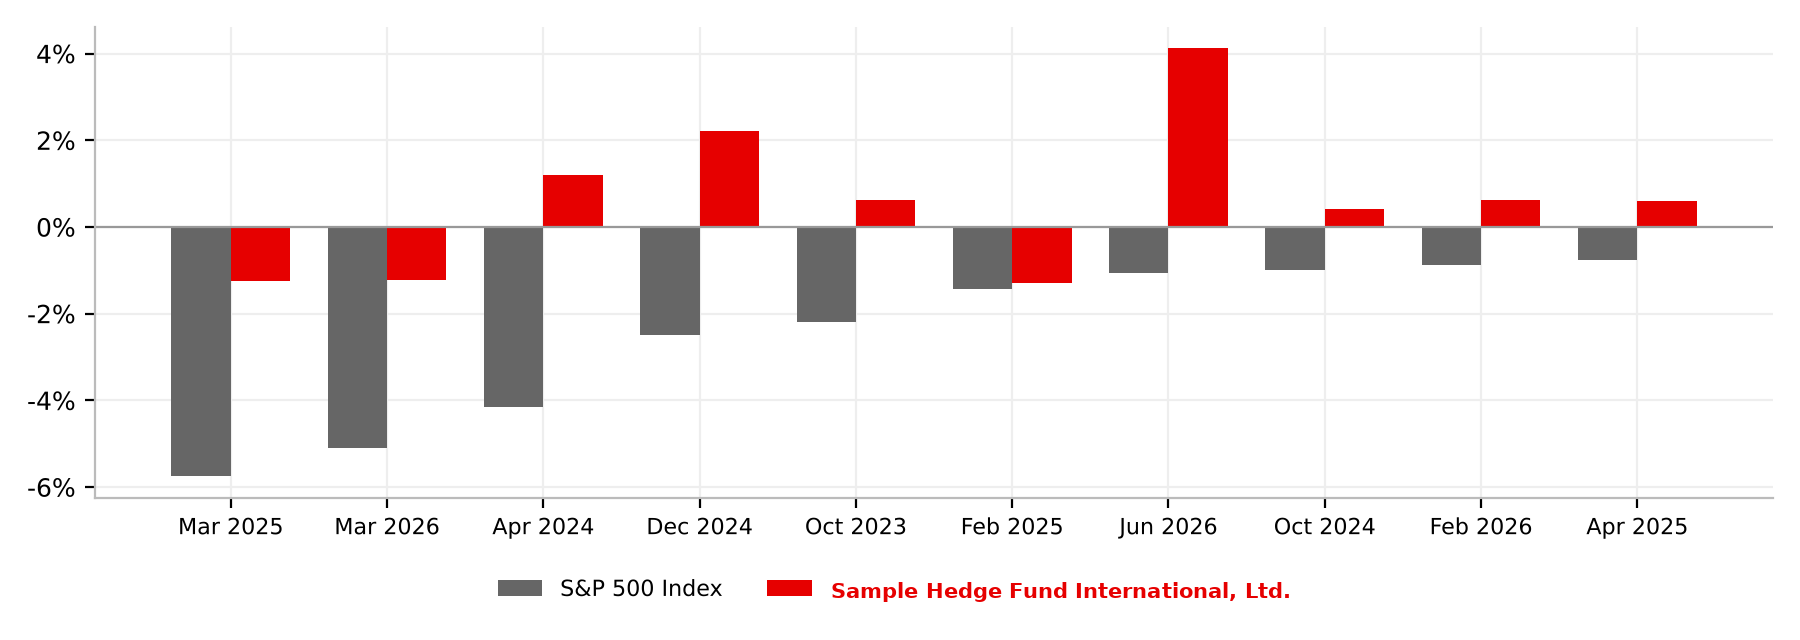
How deep the losses went, how long recovery took, and how the fund behaved when its benchmark and the equity market fell.
| # | Start | Trough | End | Drawdown | Time under water (m) | HFRI RV Index (peak to trough) |
|---|---|---|---|---|---|---|
| 1 | Feb 2025 | Mar 2025 | May 2025 | -2.51% | 4 | 0.68% |
| 2 | Jul 2026 | Sep 2026 | Ongoing | -2.33% | 3 | -0.74% |
| 3 | Mar 2026 | Mar 2026 | Mar 2026 | -1.23% | 1 | -0.29% |
Window Oct 2023 to Sep 2026 (last 3 years). The deepest fall, -2.5% in Feb to Mar 2025, was recovered by May 2025; the Jul to Sep 2026 drawdown (-2.3%) is still open at Sep 2026. COVID-19 and the Ukrainian War fall before the window; only the Iran War (Jan to Mar 2026) is inside it.
| Month | HFRI Relative Value (Total) Index | Sample Hedge Fund International, Ltd. | Outperformance |
|---|---|---|---|
| Sep 2026 | -1.14% | -0.12% | +1.02% |
| Mar 2026 | -0.29% | -1.23% | -0.94% |
| Oct 2023 | -0.18% | 0.62% | +0.80% |
| Apr 2025 | -0.13% | 0.61% | +0.74% |
| Mar 2025 | -0.03% | -1.24% | -1.21% |
| Financial crisis | Window | Sample Hedge Fund International, Ltd. | HFRI RV Index | S&P 500 | Outperf. vs B1 | Outperf. vs B2 |
|---|---|---|---|---|---|---|
| Iran War | Jan 2026 to Mar 2026 | 0.81% | 1.68% | -4.63% | -0.87% | +5.44% |
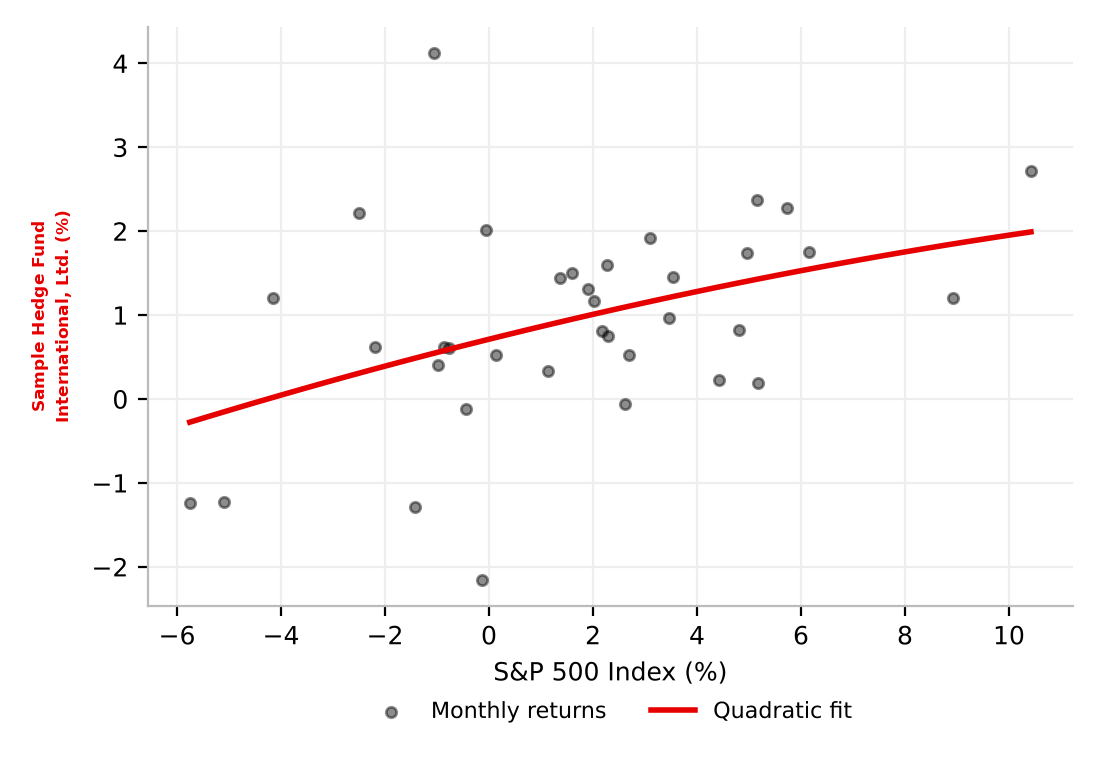
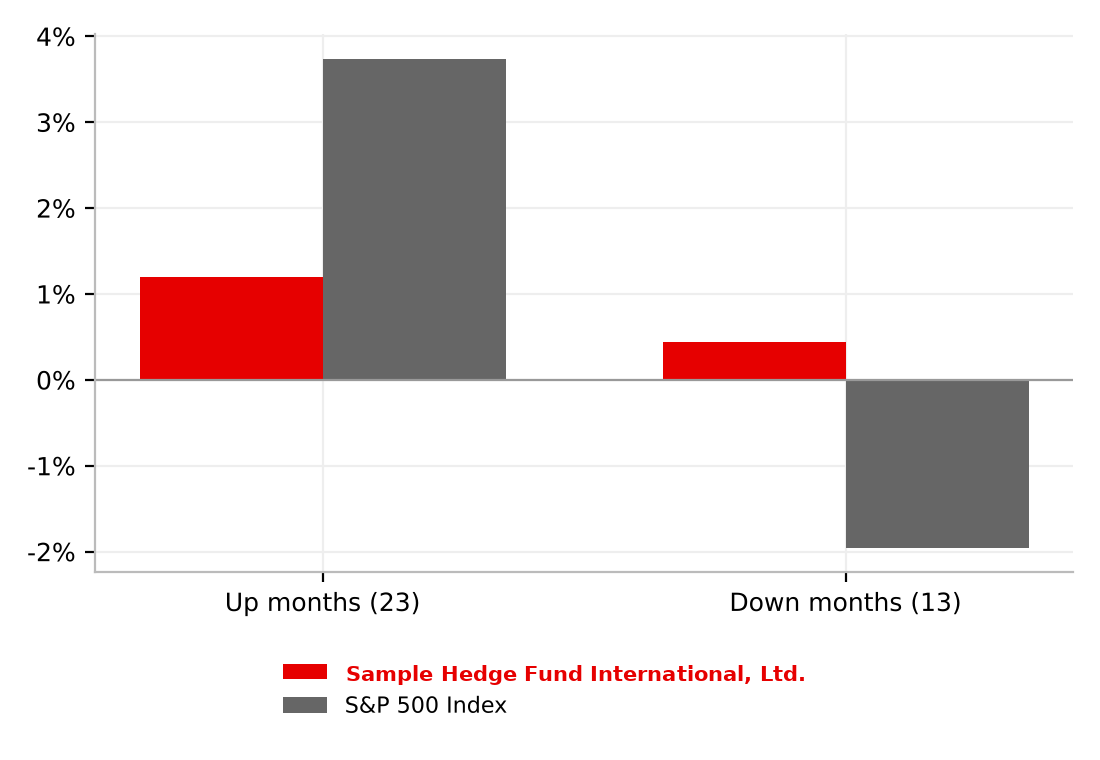
| Beta | Convexity c (x²) | t (x²) | Up-market beta | Down-market beta | Up-capture | Down-capture | Capture spread |
|---|---|---|---|---|---|---|---|
| 0.143 | -0.303 | -0.28 | 0.142 | 0.209 | 32.2% | -21.9% | 54.1% |
The curvature term is not statistically significant (|t| = 0.28 < 1.96). Up and down months: 23 and 13. A negative down-capture means the fund's average return was positive in months the S&P 500 fell. Small sample: 36 months.
Calendar-year returns against the HFRI Relative Value (Total) Index constituents. Bars show the 5th to 95th percentile bands, green is the best quartile, and the circle marks the fund.
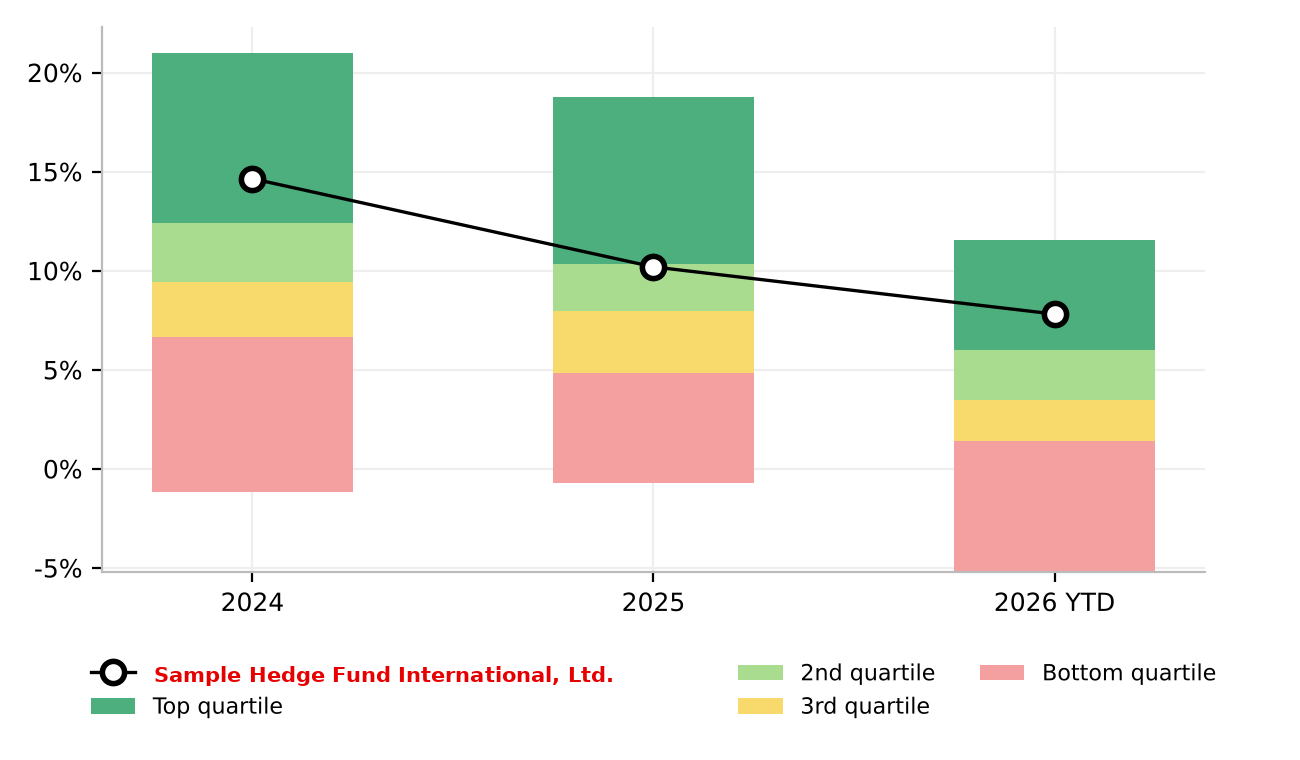
Rank is the share of the 207 HFRI Relative Value (Total) constituents the fund beats; every fund is measured by the connector over the same Oct 2023 to Sep 2026 window. Sharpe = (return - 4.5%) ÷ volatility for all funds.
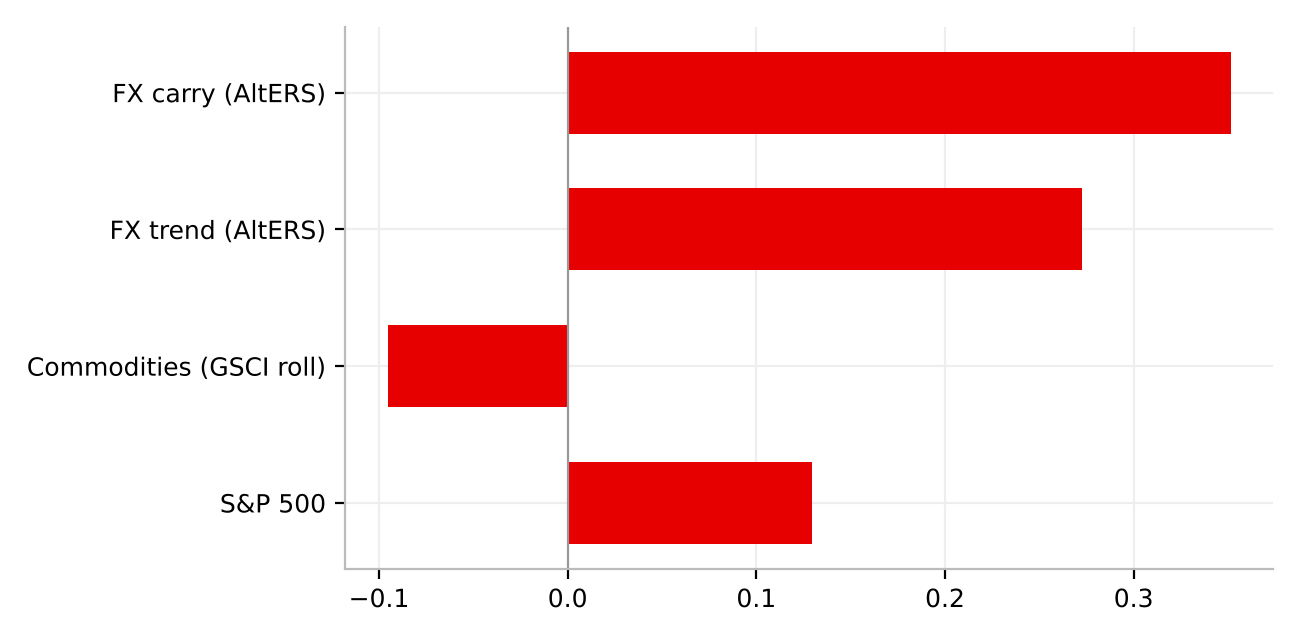
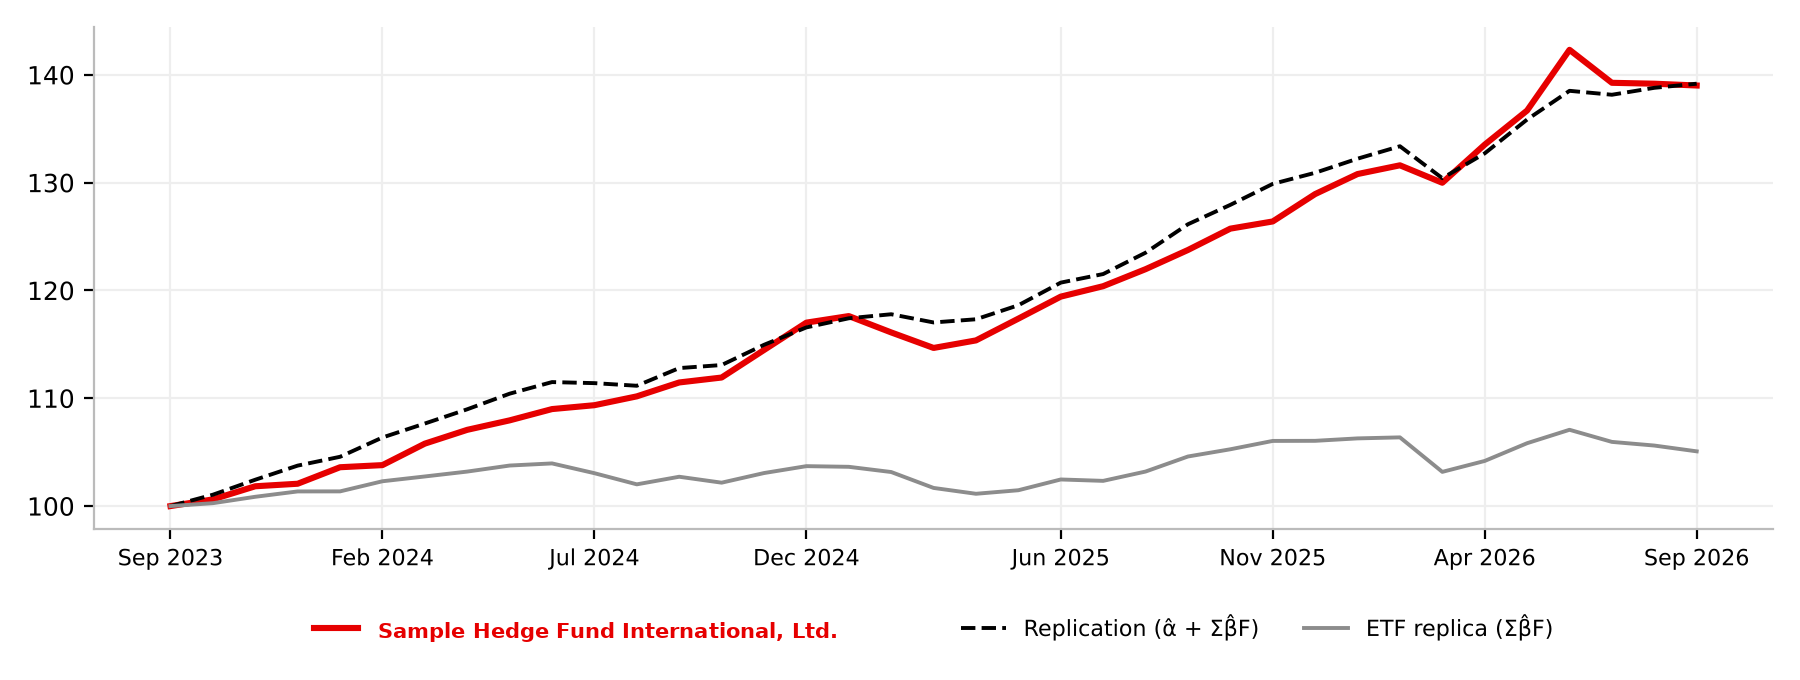
A two-step Lasso replicates the fund with factor proxies. What the factors cannot explain is alpha.
Step 1: Lasso (LassoCV, 10-fold time-series cross-validation, standardised factors, intercept not penalised) on the 16 factors of the connector's "lasso factors" set with complete data. It kept Commodity momentum (AltERS), Commodity short volatility (AltERS), Fixed-income carry (AltERS), Fixed-income trend (AltERS), FX carry (AltERS), FX trend (AltERS), Treasury 7 to 10y, Commodities (GSCI roll), Micro-cap and S&P 500.
Step 2: OLS with intercept on the kept factors plus the S&P 500, which is always kept, then backward elimination until every non-forced factor has p < 0.05 (dropped: Fixed-income carry p=0.99, Commodity short volatility p=0.87, Commodity momentum p=0.83, Fixed-income trend p=0.21, Treasury 7 to 10y p=0.20, Micro-cap p=0.26). ETF replica = Σβ̂·F; replication = α̂ + Σβ̂·F; annual alpha = α̂ × 12.
| Factor | Proxy | Step 1 Lasso β | Step 2 OLS β | t | p | Significant at 5% |
|---|---|---|---|---|---|---|
| Alpha (monthly) | Intercept | n/a | 0.78% | 4.30 | 0.000 | Yes |
| FX carry (AltERS) | AltERS VW FX Carry Global Index | 0.215 | 0.352 | 2.28 | 0.030 | Yes |
| FX trend (AltERS) | AltERS VW FX Momentum Time Series Trend Index | 0.242 | 0.273 | 2.63 | 0.013 | Yes |
| Commodities (GSCI roll) | iShares GSCI Commodity Dynamic Roll Strategy ETF | -0.060 | -0.095 | -3.27 | 0.003 | Yes |
| S&P 500 | S&P500 Index | 0.041 | 0.129 | 3.03 | 0.005 | Yes |
| Fit statistic | Value |
|---|---|
| R² / adjusted R² | 0.530 / 0.470 |
| F-stat (4, 31) | 8.75 (p 0.0001) |
| Durbin-Watson | 2.31 |
| Tracking error (residual sd × √12) | 3.08% |
| Lasso λ (CV) | 0.0008 |
What the fund charges, how that compares with the HFRI Relative Value (Total) Index peers, and whether the alpha covers it.
| Measure | Sample Hedge Fund International, Ltd. | Peer median | Peer min | Peer max | Rank (1 = cheapest) |
|---|---|---|---|---|---|
| Management fee | 0.00% | 1.50% | 0.00% | 2.35% | 1= / 206 |
| Performance fee rate | 20% | 20% | 0% | 30% | 88= / 206 |
| Performance fee collected / yr | 2.90% | 1.81% | 0.00% | 9.18% | 167 / 206 |
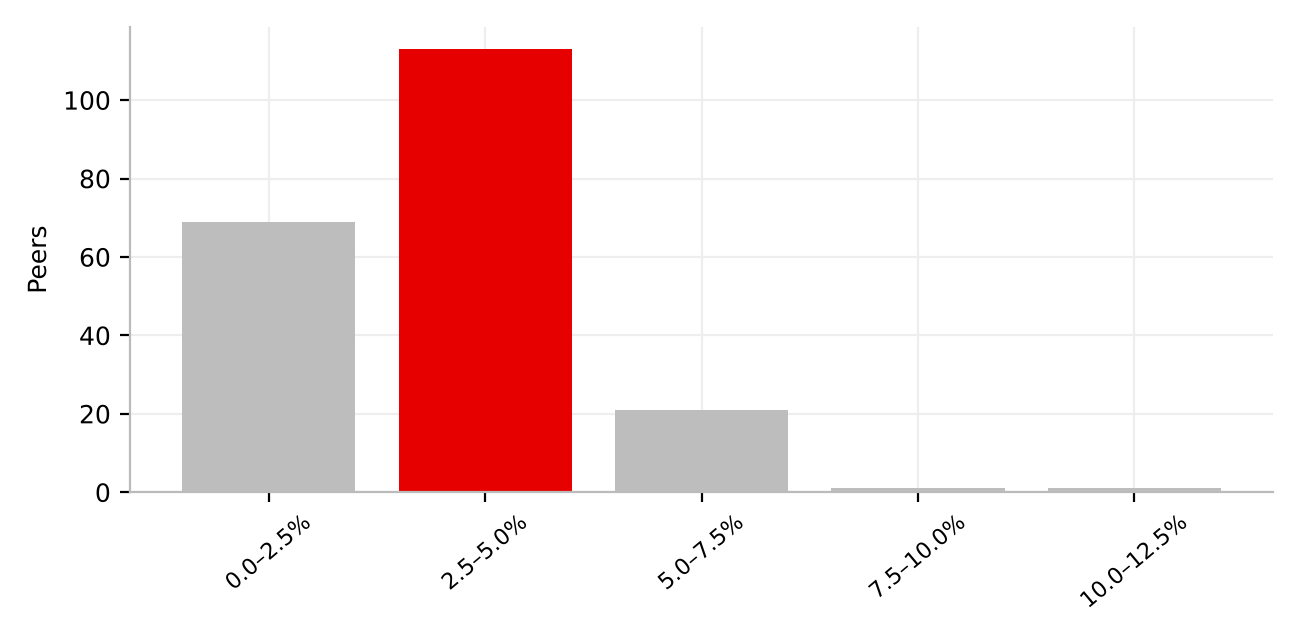
| Total fee / yr | 2.90% | 3.19% | 0.20% | 11.18% | 90 / 206 |
| Jensen alpha ÷ total fee | 1.62× | 0.56× | -11.18× | 27.20× | 36 / 206 |
Gross return = net annualized return ÷ (1 - performance fee) + management fee; total fee = gross return × performance fee + management fee (performance fee = 0 when net return ≤ 0). Fee coverage ratio = annual alpha (2-step Lasso) ÷ total fee. Fund: 11.61% ÷ 0.80 + 0% = 14.51% gross; 14.51% × 20% + 0% = 2.90% total fee.
The peer row "Jensen alpha ÷ total fee" uses Jensen alpha = ret - [4.50% + β × (S&P 500 21.29% - 4.50%)] for every fund including the fund shown here (β 0.14, Jensen alpha 4.71%); rank 1 = highest coverage. Fees for the fund (0.00% / 20%): performance fee 20% from the connector; management fee not recorded, taken as 0%. Two peers with blank fee fields were excluded.
The static data behind the analysis, as held by the connector.
| Fund name | Sample Hedge Fund International, Ltd. - USD |
| Strategy | Multi-strategy: seeks to exploit market inefficiencies and engage in financial arbitrage, allocating capital across a diverse set of strategies and asset classes |
| Domicile / currency | Cayman Islands · USD |
| Management / performance fee | Management fee not recorded in the connector (0% used in the fee section) / 20% performance fee |
| Liquidity | Quarterly redemption, 0-day notice, no redemption fee; subscription frequency "Other" |
| Track record in connector | Jan 1990 to Sep 2026; months before Oct 2023 come from the proxy series. This report uses Oct 2023 to Sep 2026 (36 months) |
| Benchmarks | Connector settings: Credit Suisse Multi-Strategy Hedge Fund Index and S&P 500; this report uses HFRI Relative Value (Total) Index and S&P 500 |
Fund AUM is recorded as 29,090,000 in the "Fund AUM (m)" field. Minimum investment is recorded as 0. Administrator, auditor, custodian and prime broker are not recorded.
A branded PDF copy of this report, with every table and chart, ready to read offline or share with your team.
Sample Hedge Fund International, Ltd. · Factsheet generated 21 Oct 2026 · Source: AlternativeSoft connector. For professional / qualified investors only. Past performance is not a reliable indicator of future results. Return series come from the AlternativeSoft connector; all statistics, regressions and derived figures are computed from them. This document is not an offer or solicitation.
Connect AlternativeSoft MCP to the AI assistant your team already uses, and ask for performance, peer ranking, factor alpha and fees on any fund in your universe.
Complete the form and we'll respond within one business day.