Market Analysis

Top Performing Funds from March 2020 to March 2021

The twelve months after the Covid-19 sell-off produced some of the strongest returns on record. This page compares four equity indices, the largest mutual fund and the largest hedge fund over that period, ranked on return and risk together, and explains what the result does and does not tell you.

This page covers:The resultWhat was comparedHow the ranking worksReading the period
Trusted by
Aberdeen Asset Management•AllianceBernstein•BNP Paribas•Bessemer Trust•Raiffeisen Capital Management•Unigestion•Lyxor Asset Management•Kedge Capital•Lumyna Investments•Progressive Capital•Aberdeen Asset Management•AllianceBernstein•BNP Paribas•Bessemer Trust•Raiffeisen Capital Management•Unigestion•
Key finding
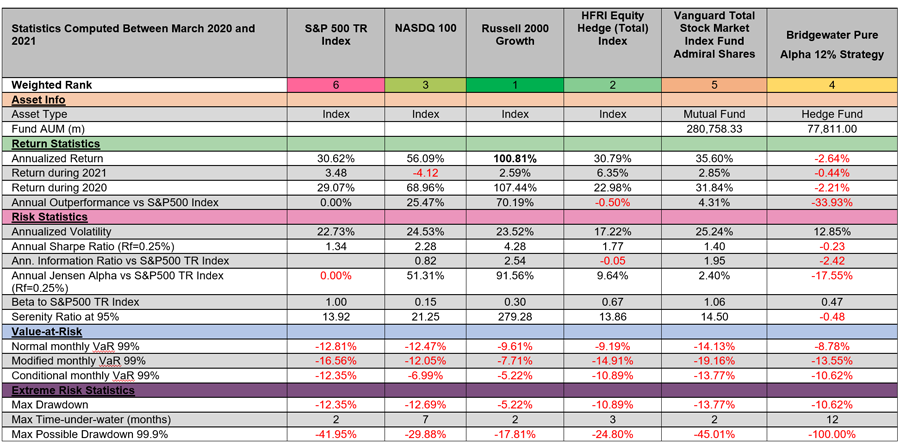
The Russell 2000 Growth index ranked first of the six assets compared, with an annualised return of 100.81% and the best maximum drawdown of the group. The HFRI Equity Hedge (Total) Index ranked second and the NASDAQ 100 third. Bridgewater Pure Alpha 12% Strategy had a negative annualised return but lower risk metrics, and ranked fourth.

What Was Compared

The analysis used the Compare Assets feature in AlternativeSoft to set indices and funds side by side over March 2020 to March 2021.

AssetType
S&P 500Equity index
NASDAQ 100Equity index
Russell 2000 GrowthEquity index
HFRI Equity Hedge (Total) IndexHedge fund index
Vanguard Total Stock Market Index Fund Admiral SharesLargest mutual fund by assets
Bridgewater Pure Alpha 12% StrategyLargest hedge fund by assets, and the largest fund of Bridgewater Associates

How the Ranking Was Built

Ranking on return alone rewards whichever asset took the most risk. The comparison therefore used a weighted ranking of four statistics, with half the weight on return and half on risk.

StatisticWeight in the ranking
Annualised return50%
Normal monthly VaR25%
Annualised volatility12.5%
Maximum drawdown12.5%
Statistics computed between March 2020 and March 2021 for four indices, a mutual fund and a hedge fund
Statistics computed between March 2020 and March 2021. Source: Eurekahedge, Morningstar, AlternativeSoft.

How to Read This Period

  • The start date does a lot of work: March 2020 was the low point of the Covid-19 sell-off, so a twelve-month window from that month captures the whole rebound and none of the fall.
  • High-beta assets lead rebounds: Small-cap growth stocks fell hard and recovered hardest, which is why the Russell 2000 Growth leads on return.
  • The weights decide the middle of the table: A fund with a negative return can still place fourth of six when half the ranking rewards low risk.
  • One period is not a verdict: The same six assets ranked over a different window would produce a different order.

Run the Same Comparison on Your Own Funds

The method matters more than this particular result. In AlternativeSoft you can choose any funds and indices from a database of 500,000+, set the period, pick from 4,000+ statistics and weight them to reflect what your committee cares about.

This article is for information and education only. It is not investment advice or a recommendation to buy, sell or hold any investment. Past performance is not a guide to future returns. Based on analysis by Vincenzo Taddeo, first published by AlternativeSoft in March 2021.

150+
Institutional Clients
Worldwide
$1.5tn+
AuM Managed by
Our Clients
500k+
Funds in Our
Database
20+
Years of Excellence
Since 2005
Client Testimonials

Trusted by 150+ Leading Institutions

“

AlternativeSoft streamlines many useful performance-based analytics including portfolio optimisation, peer evaluation, and relative analyses. An intuitive platform that is additive to our processes.

Aberdeen Asset Management
Head of Risk Management
★★★★★
“

A practical and user-friendly tool used as part of our portfolio construction and risk management process. Their extensive support and responsiveness provides real added value.

AllianceBernstein
Co-head, Risk Management & Portfolio Construction
★★★★★
“

From statistical analysis on a single hedge fund to portfolio construction, risk analysis and stress testing - one of the most effective and intuitive tools I have handled.

BNP Paribas
Hedge Fund Solutions
★★★★★
Best Risk Management Software
Hedgeweek - 4 Consecutive Years
Best Portfolio Analytics Platform
HFM European Awards
10+ Industry Awards
Recognised since 2005
ISO & GDPR Compliant
Enterprise-grade Security
FAQ

Frequently Asked Questions

Of the six assets compared, the Russell 2000 Growth index ranked first, with an annualised return of 100.81% and the best maximum drawdown of the group.
They were ranked on a weighted combination of four statistics: 50% annualised return, 25% normal monthly VaR, 12.5% annualised volatility and 12.5% maximum drawdown.
Half of the ranking weight was placed on risk measures. Bridgewater Pure Alpha 12% Strategy had a negative annualised return over the period but lower risk metrics than several of the other assets.
No. The period begins at the low point of the Covid-19 sell-off, which favours assets that rebounded most. Past performance is not a guide to future returns.
Yes. The Compare Assets feature in AlternativeSoft lets you select any funds and indices, set the period and choose and weight the statistics used for the ranking.
Request a Demo

See AlternativeSoft
in Action

Join 150+ institutional investors who rely on AlternativeSoft to select and monitor funds. Book a personalised demo with our team today.

  • Live walkthrough of the full platform
  • Tailored to your asset class - hedge funds, mutual funds or private markets
  • Q&A with our investment analytics specialists
  • Free trial access available following the demo
  • Dedicated onboarding and implementation support
Hedgeweek Best Risk Management Software: voted by clients 4 years running
Data integrations include:
BloombergeVestmentMorningstarPreqinPitchbookHFR

Book Your Demo

Complete the form and we’ll respond within one business day.