
The original study and its March 2020 results are unchanged below. We have added the methodological caveats that matter when you read a result like this, and a note on what a high Sharpe ratio does and does not tell you about a manager.
Key takeaways
- The high Sharpe cohort held up. 32 funds with a Sharpe ratio above 4 returned +1.13% in March 2020, against -6.98% for the HFRI Fund Weighted Composite and -12.35% for the S&P 500 TR Index.
- A Sharpe ratio above 4 sustained over a decade is unusual enough to warrant scrutiny, not just admiration. It can indicate genuine skill, or it can indicate smoothed valuations and hidden tail risk.
- March 2020 was a liquidity shock, not a slow grind. It rewarded a specific risk profile, and a single stress month cannot validate a strategy on its own.
- The screen is worth repeating, across multiple stress windows, before drawing conclusions about any individual manager.
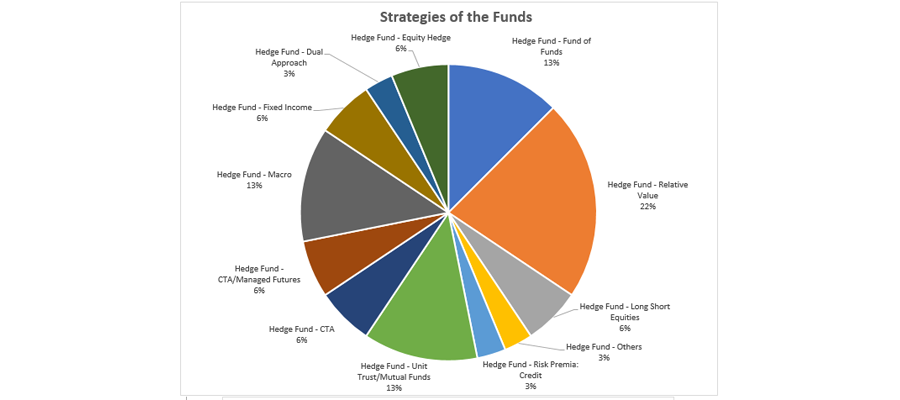
We selected 32 hedge funds with an annual Sharpe ratio greater than 4 during the period January 2010 to February 2020, each with at least $10m of assets under management, and compared their March 2020 returns against the HFRI Fund Weighted Composite and the S&P 500 TR Index.
The data was kindly provided by Hedge Fund Research and EurekaHedge. Our sample of 32 hedge funds had an average annual Sharpe ratio of 11.10 during January 2010 to February 2020.
March 2020 results
The 32 funds delivered +1.13% in March 2020, against -6.98% for the HFRI Fund Weighted Composite and -12.35% for the S&P 500 TR Index.
| March 2020 | Return |
|---|---|
| 32 hedge funds with a Sharpe ratio above 4 | +1.13% |
| HFRI Fund Weighted Composite | -6.98% |
| S&P 500 TR Index | -12.35% |
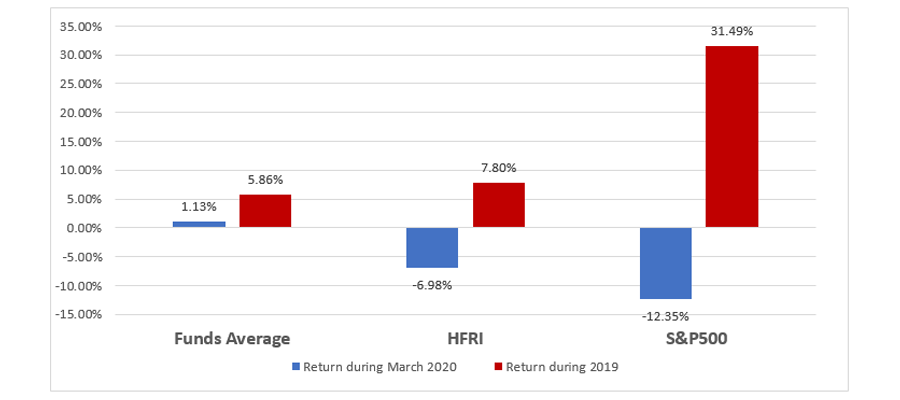
The cohort with the highest annual Sharpe ratios outperformed the HFRI index by a wide margin and was the only one of the three groups to finish the month positive.
What a Sharpe ratio above 4 actually tells you
This is the section we would add if we were writing the study today, because the headline result is easy to misread.
A Sharpe ratio above 4 sustained across a decade is extraordinarily rare. An average of 11.10 across a cohort is rarer still. Numbers at that level are worth interrogating before they are worth celebrating, because there are three quite different explanations and they lead to opposite conclusions.
- Genuine skill in a niche strategy. Some managers really do run strategies with a high ratio of return to realised volatility, typically in capacity-constrained niches. This is the interpretation everyone reaches for first, and it is sometimes correct.
- Smoothed or stale valuations. Funds holding illiquid or infrequently marked positions report artificially low volatility, which mechanically inflates the Sharpe ratio. The risk has not gone anywhere. It is simply not visible in the monthly return series.
- Short volatility exposure. Strategies that collect small, steady premiums by selling optionality produce beautiful Sharpe ratios for years, then a single catastrophic month. The ratio looks best immediately before the risk materialises.
The Sharpe ratio cannot distinguish between these three, because it treats all volatility as equal and assumes returns are roughly normally distributed. Hedge fund returns frequently are not. This is precisely why skewness, kurtosis, maximum drawdown and downside deviation belong alongside it rather than after it.
Reading the March 2020 result correctly
The result stands: This cohort did protect capital in a month when almost nothing else did. But a single stress event validates a specific risk profile, not a strategy.
March 2020 was a fast liquidity shock followed by an unusually rapid, policy-driven recovery. It rewarded managers who were short risk, defensively positioned or genuinely uncorrelated. It punished leverage and crowded positioning. A different kind of stress, a slow grind, a rates shock, or a prolonged correlation regime change, would sort the same cohort differently.
It is also worth noting what the screen cannot see. A minimum AUM filter and a requirement for a full decade of history select for funds that survived that decade. Managers who ran similar strategies and failed before February 2020 are not in the sample, which flatters the result by construction. This is survivorship bias, and it affects every backward-looking screen unless it is explicitly corrected for.
Repeating this analysis
The methodology is deliberately simple and worth rerunning: A risk-adjusted return threshold over a defined lookback, a minimum AUM filter, then a comparison against a chosen benchmark over a defined stress window.
What makes it genuinely informative rather than merely interesting is doing three things the original study did not:
- Test several stress windows, not one. A cohort that protects capital in three unrelated drawdowns is telling you something. A cohort that protects capital in one is telling you about that month.
- Screen on more than the Sharpe ratio. Add maximum drawdown, downside deviation, skewness and kurtosis to the same screen and the membership of the cohort changes noticeably.
- Run it across the full universe, including funds that have since closed, rather than a shortlist of survivors.
All three are straightforward once the analysis sits on a full fund database rather than a spreadsheet, which is the point at which changing the ratio, the window or the benchmark rebuilds the peer group in seconds rather than days.
Frequently asked questions
Did high Sharpe ratio hedge funds outperform in March 2020?
Yes. A sample of 32 hedge funds with an annual Sharpe ratio above 4 over January 2010 to February 2020 returned +1.13% in March 2020, compared with -6.98% for the HFRI Fund Weighted Composite and -12.35% for the S&P 500 TR Index. They were the only one of the three groups to finish the month positive.
Is a Sharpe ratio above 4 a good sign?
Not automatically. It can reflect genuine skill in a capacity-constrained strategy, but it can also reflect smoothed valuations on illiquid holdings that understate true volatility, or a short volatility strategy that collects steady premiums until a single severe loss. The ratio itself cannot distinguish between these, which is why it should be read alongside maximum drawdown, downside deviation, skewness and kurtosis.
What are the limitations of this study?
Three matter most. It measures a single stress month, which rewards one particular risk profile rather than validating a strategy. It requires a full decade of history and a minimum AUM, so it only includes funds that survived, which is survivorship bias. And it screens on the Sharpe ratio alone, which assumes returns are roughly normally distributed when hedge fund returns often are not.
How do you screen hedge funds by risk-adjusted return?
Set a risk-adjusted return threshold over a defined lookback period, apply a minimum AUM filter, then compare the resulting cohort against a chosen benchmark over one or more stress windows. Doing it well means running the screen across a full fund database including closed funds, and combining the Sharpe ratio with drawdown and distribution measures rather than relying on it alone.
Sources
- Hedge Fund Research (HFR) and EurekaHedge, fund return data January 2010 to March 2020
- AlternativeSoft analysis, originally published 6 May 2020
Analyse this yourself, on your own universe
AlternativeSoft is an award-winning quantitative analytics platform for asset selection, portfolio construction and customised reporting. Screen 500,000+ funds, build genuine peer groups, run risk-adjusted comparisons and produce the report in minutes rather than weeks.