
The original Q3 data below is unchanged and is now best read as a historical snapshot. We have added the part that turned out to matter far more than the individual names: What crowded short positioning does to a portfolio, and how to measure your own exposure to it.
Key takeaways
- The names on a most-shorted list matter far less than the crowding itself. Concentration in the same positions across many funds is the risk.
- Crowded shorts carry squeeze risk that is invisible in any single fund's reporting and only appears when you aggregate across managers.
- The January 2021 short squeeze demonstrated how quickly crowded positioning can reprice, and how badly it can hurt funds that had no idea how much company they had.
- The allocator question is not which stocks are shorted, but how much of your own portfolio is expressed through the same handful of positions.
The stocks that hedge funds are betting most against, ranked by the value of short interest, and why the concentration matters more than the constituents.
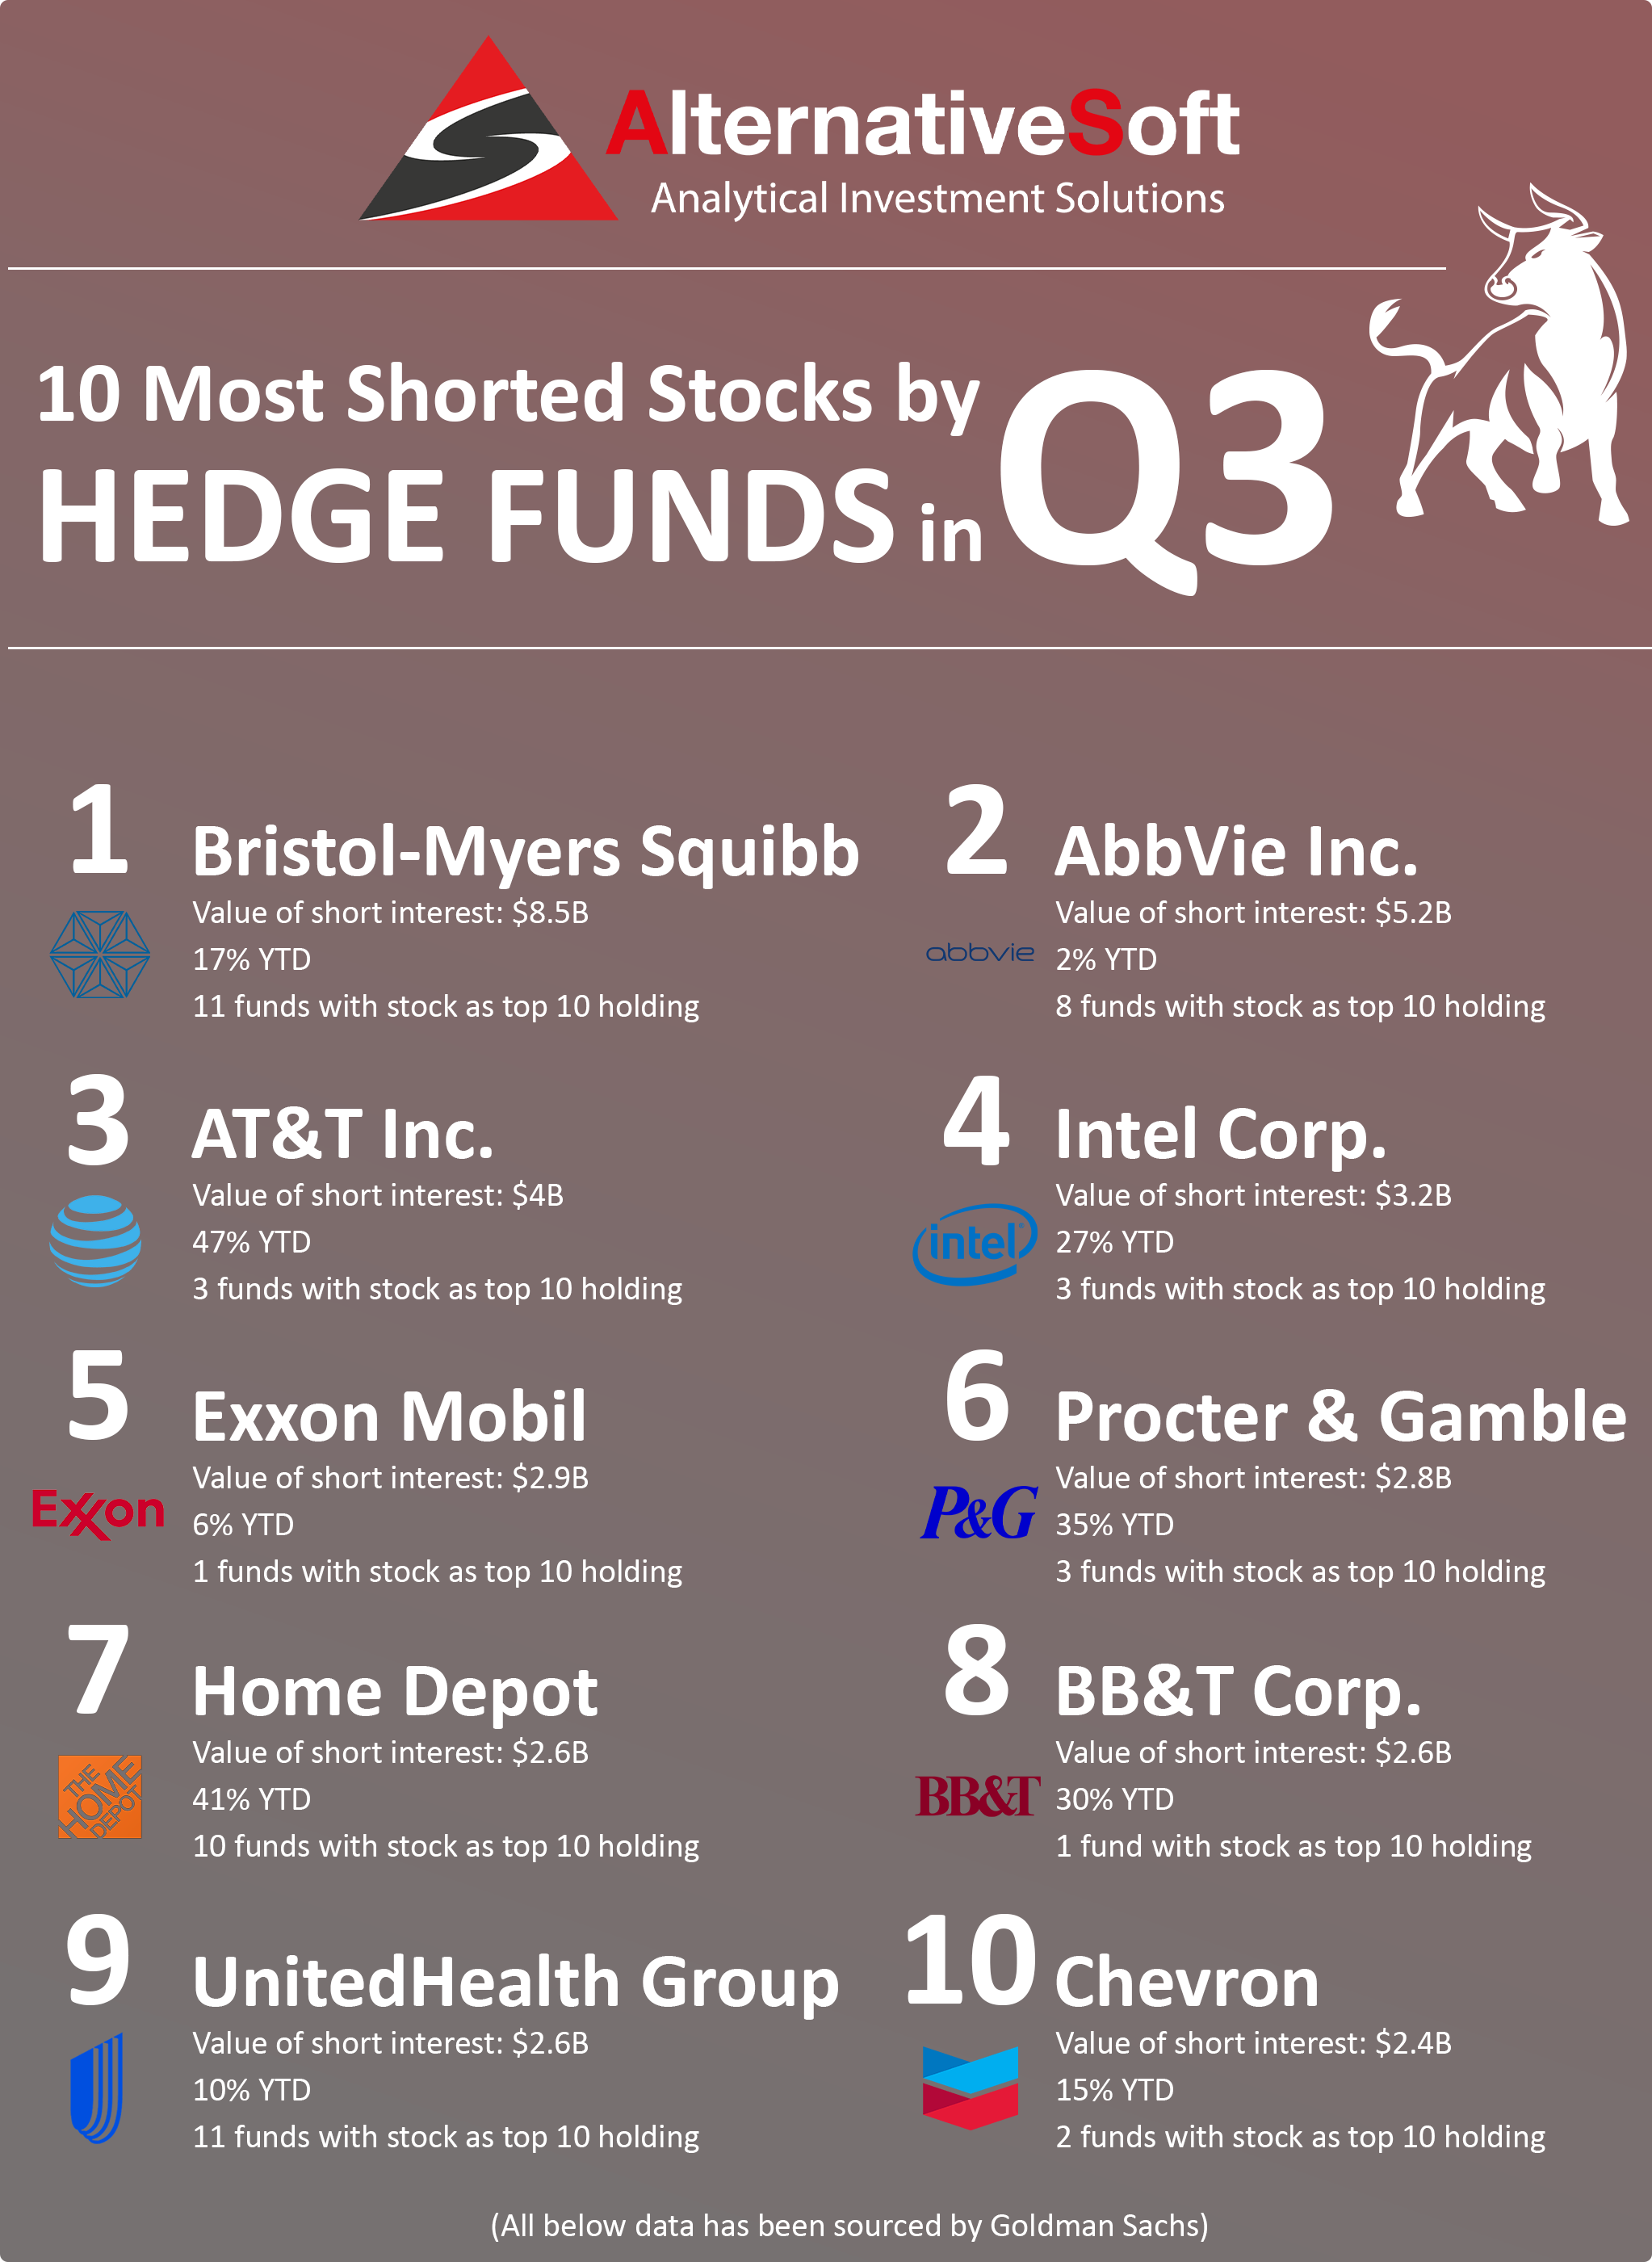
The data below was compiled by Goldman Sachs from 833 top hedge funds with $2.1tn in equity positions, including $700bn of short positions. It is a snapshot of one quarter, and the individual names have long since rotated. The structural pattern it illustrates has not.
Below are the ten stocks that represented the largest short positions at the time, ranked in order of increasing value of short interest.
Why crowding matters more than the names
A most-shorted list is usually read as a set of stock ideas. That is the least useful way to read it.
What the list actually describes is concentration. When several hundred funds independently reach the same conclusion about the same company, the position stops behaving like a bet on that company's fundamentals and starts behaving like a bet on the other holders. The fundamental thesis can be entirely correct and the trade can still be ruinous, because the exit is narrow and everyone reaches it at the same moment.
The clearest demonstration came in January 2021, when several heavily shorted names repriced violently in a matter of days. Funds carrying crowded short positions faced simultaneous margin pressure and were forced to cover into a rising market, amplifying the move. Very little about the underlying businesses had changed. What changed was the positioning.
The risk an allocator cannot see fund by fund
Here is the problem specific to multi-manager portfolios.
Each manager in your book reports their own positions, exposures and risk metrics, and each one may look perfectly well diversified in isolation. Crowding risk does not appear at that level. It only becomes visible when you aggregate holdings across every manager and look at the combined book.
An allocator holding eight equity managers can easily discover, after the fact, that six of them were short the same three names, or long the same crowded momentum basket. No individual manager did anything wrong. The portfolio was nonetheless running a concentrated position that nobody had authorised, because nobody was looking at the aggregate.
How to measure it
Four measures answer most of the question, and all of them require look-through holdings data rather than fund-level reporting.
- Overlap: The proportion of holdings shared between any two managers in your portfolio. High overlap between managers you selected for diversification means you are paying two fees for one exposure.
- Active share: How far each manager's book actually diverges from its benchmark. A low active share alongside a high fee is a straightforward finding worth acting on.
- Peer share: How much of a manager's book is shared with their peer group rather than their benchmark. This is what identifies crowding directly, and it is the measure most allocators do not run.
- Aggregate exposure by name, sector and factor: Your true combined position in any single security or theme once every manager's holdings are consolidated, both long and short.
Run continuously rather than at quarter end, these turn a positioning report from something you read about the market into something you read about your own portfolio.
Using positioning data well
Prime brokerage positioning data of the kind behind the original list is genuinely useful, provided it is used as context rather than as a signal. It tells you where the industry is leaning. What it cannot tell you is whether you are leaning the same way, and by how much. That answer only comes from your own holdings, aggregated across every manager you hold and measured against the peer group they trade alongside.
Frequently asked questions
What were the most shorted stocks by hedge funds in Q3?
The ten largest short positions by value of short interest are shown in the chart above, compiled by Goldman Sachs from 833 hedge funds holding $2.1tn in equity positions including $700bn of shorts. The specific names reflect that quarter and have since rotated, so the list is best treated as a historical snapshot.
Why does crowded short positioning matter?
Because a heavily shorted stock stops trading purely on fundamentals and starts trading on positioning. When many funds hold the same short, any upward move forces simultaneous covering, which amplifies the move further. The January 2021 squeeze episode showed how quickly this can happen and how much damage it does to funds that were unaware how much company they had in the trade.
How can an allocator measure crowding across managers?
Through look-through holdings analysis rather than fund-level reporting. The four measures that matter are overlap between managers, active share against the benchmark, peer share against the manager's peer group, and aggregate exposure by name, sector and factor once every manager's holdings are consolidated.
Is short interest data a useful investment signal?
It is more useful as context than as a signal. It shows where the industry is positioned, which is valuable for understanding squeeze risk and sentiment. It cannot tell you how exposed your own portfolio is to the same positions, which requires aggregating your managers' holdings and comparing them against the wider peer group.
Sources
- Goldman Sachs prime brokerage positioning data, Q3 2019
- AlternativeSoft analysis
Analyse this yourself, on your own universe
AlternativeSoft is an award-winning quantitative analytics platform for asset selection, portfolio construction and customised reporting. Screen 500,000+ funds, build genuine peer groups, run risk-adjusted comparisons and produce the report in minutes rather than weeks.