
In this article we will evaluate the usefulness of the Ulcer Index and Serenity Ratio when selecting funds. We will first explain the two metrics and how are they related and then evaluate to what extent Serenity Ratio can outshine the Sharpe Ratio when selecting best performers.
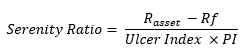
The Serenity Ratio is an alternative measure to the Sharpe Ratio that accounts for extreme risk. While the latter only divides return premium by the annualized volatility, the Serenity Ratio uses the Ulcer Index and a Pitfall Indicator (PI) as risk measures to quantify the tendency of a fund to be “stuck” in drawdown.
The Ulcer Index was first coined by Martin and McCann in 1989, as a volatility indicator to quantify downside risk. It is calculated with the quadratic mean of the drawdowns:
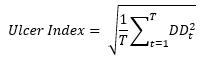
Where t is the time and DD is drawdown. The higher the Ulcer Index is, the higher the tendency of the fund to incur a drawdown.
The Pitfall Indicator (PI) is a coefficient that indicates the magnitude (or depth) of these drawdowns. The calculation is the ratio of the Conditional Drawdown at Risk (for a given level of significance) by the volatility:
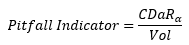
Where the CDaR (at α confidence level) is computed as the Conditional Value at Risk but on drawdowns instead of returns. The higher the Pitfall indicator is, the deeper are the extreme drawdowns of a fund.
The product of Ulcer Index and Pitfall Indicator is known as Penalized Risk.
To verify whether the Serenity Ratio can find better historically performing funds, we have created two equally weighted portfolios of 10 Equity Hedge Funds denominated in USD and selected from the HFR universe. One portfolio will have the 10 highest Serenity Ratios, the second will have the 10 highest Sharpe Ratios.
Table 1 - Composition of Portfolio 1, including top 10 Serenity Ratios. Source: AlternativeSoft, HFR.
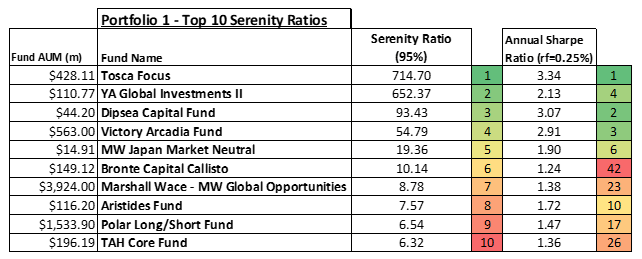
Table 2 - Composition of Portfolio 2, including top 10 Sharpe Ratios. Source: AlternativeSoft, HFR.
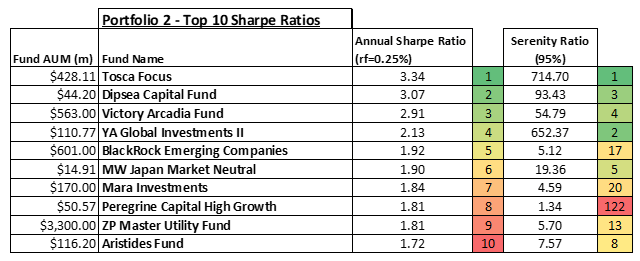
As we can see from the 2 portfolios above, 6 out of 10 assets are in both portfolios and that Tosca Focus asset had the highest historical (inception-2020) Serenity and Sharpe ratio.
The two portfolios’ performances have been computed using common returns length (January 2011- Dec 2020) and are rebalanced semi-annually.
Figure 1 - Comparison of the two portfolios' statistics, Source: AlternativeSoft
The table above shows how the Portfolio 1, with the highest Serenity Ratios, had higher returns statistics during the 10 years period, outperforming Portfolio 2 by 50.57%.
Value at risk as well as extreme risk statistics appear to lean in favor of Portfolio 1.
In conclusion, this article has highlighted how important it is to consider more metrics and not to solely rely on the direct yet oversimplistic Sharpe Ratio. Measures such as the Serenity, Sortino or Smart Sharpe ratio, allow investors to place more emphasis on extreme drawdown tendencies while relaxing undesired penalties on upward deviations.
Serenity Ratio as well as many other metrics are available in a few clicks with AlternativeSoft.
Resources:
Martin, Peter G. and Byron B. McCann. “The Investor's Guide to Fidelity Funds.” (1989).
Baguenault de Viéville, R., Gelrubin, R., Lindet, E. and Chevalier, C., “An Alternative Portfolio Theory”, KeyQuants (2018)
N.B. This article does not constitute any professional investment advice or recommendations to buy, sell, or hold any investments or investment products of any kind, and should be treated as more of an illustrative piece for educational purposes.
To trial a truly powerful and comprehensive analytic software for investment decisions, fund allocation, and our new, innovative digital due diligence visit alternativesoft.com , call us on +44 20 7510 2003, or email us information@alternativesoft.com
71 Carter Lane, London
EC4V 5EQ
+44 20 7510 2003