
We find that Rachev Ratio has predictive power when aiming to reduce Max Drawdowns.
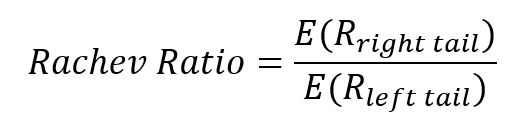
Rachev ratio is a useful statistic that divides the average of right tail (extreme positive) returns by the average of left tail (extreme negative) returns at given percentiles equidistant from the mean. It goes without saying that the lower this ratio is, the higher is the probability of extreme gains relative to extreme losses. (assuming a negative left tail CVaR)
In this article we will evaluate whether Rachev Ratio can be a metric used to avoid significant drawdowns. To do so, we will select the 10 top AUM Long Short Equity Hedge funds that have a long track record (>15 years). All the funds are available for sale in the US and are traded in USD.
We will compute the Rachev Ratio for the 10 funds between 2005 and 2019 and check if the assets with the lowest Rachev Ratio managed to mitigate their drawdown during the 2020 financial crisis caused by COVID-19.
Table 1: Historical Rachev Ratio 2005 – 2019. Source: AlternativeSoft, HFR, Eurekahedge.
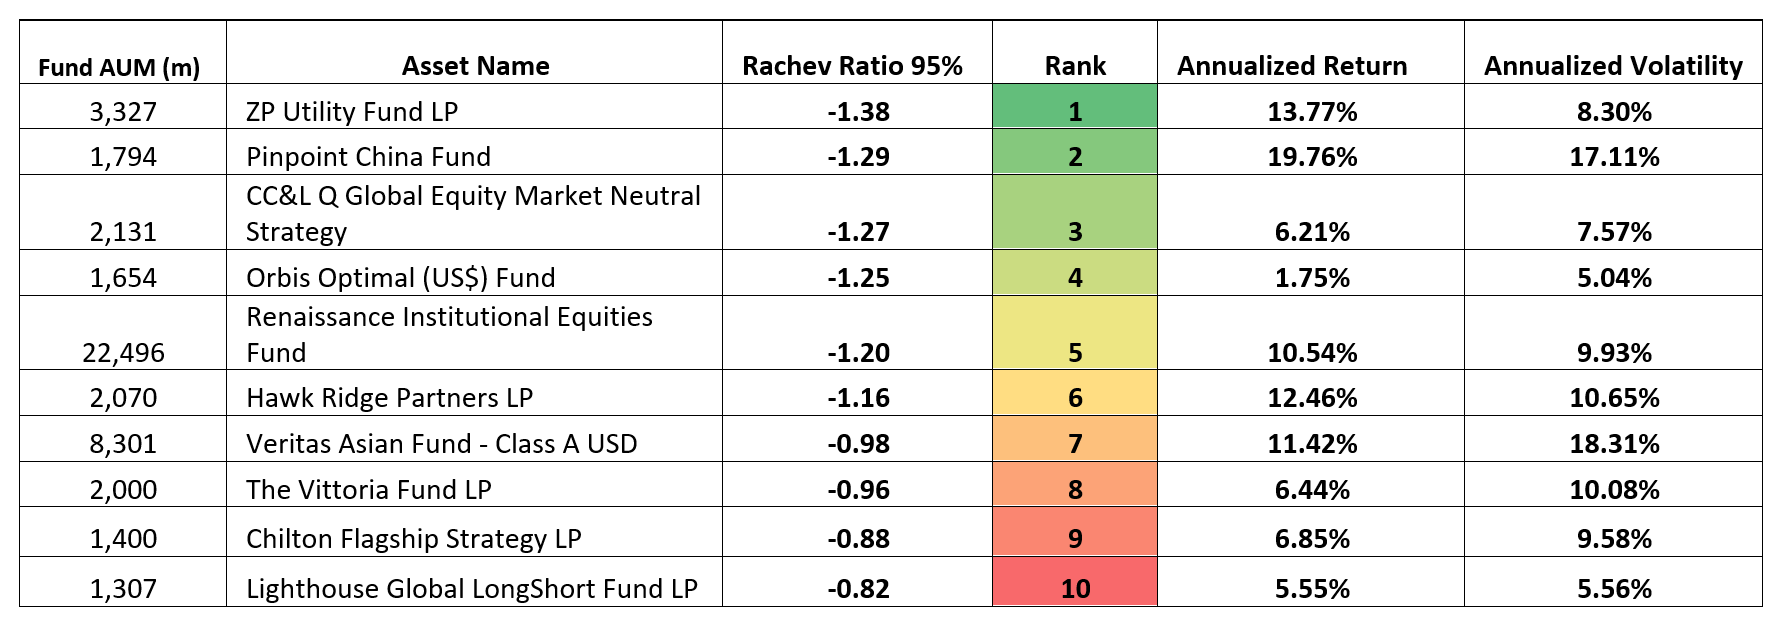
Table 1 above shows the top 10 AUM L/S Equity HFs available for sale in the US, with a track record greater than 15 years and ranked by their Rachev Ratio. These statistics have been computed between 2005 and 2019.
Table 2: Statistics for 10 Funds during 2020. Source: AlternativeSoft, HFR, Eurekahedge.
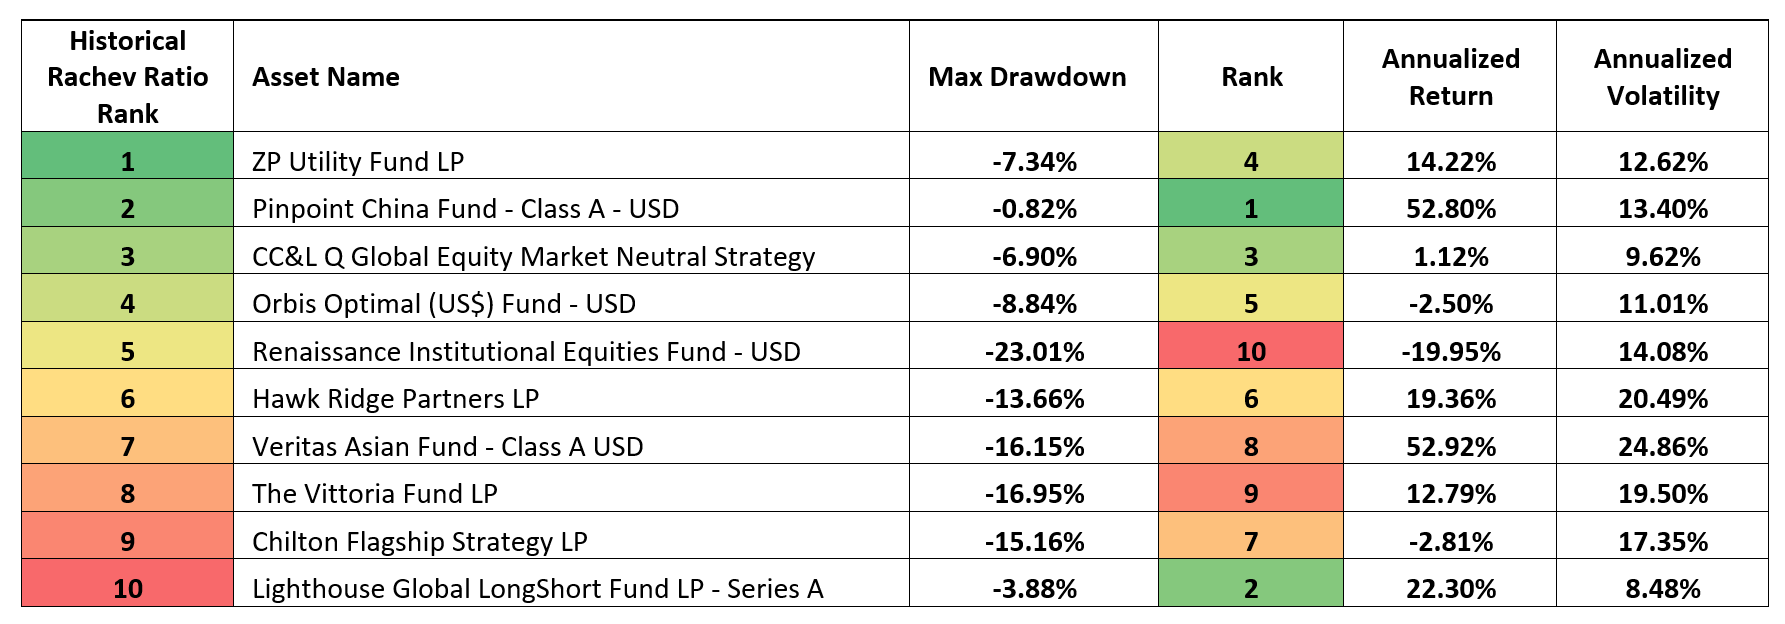
In table 2 we computed Max Drawdown, Annualized Return and Annualized Volatility for the 10 Long Short Hedge Funds during 2020. It can be highlighted how, apart of 2 exceptions, there has been a tendency for funds that had a low Historical Rachev Ratio to mitigate drawdowns during 2020. The lowest 4 Rachev Ratios between 2005 and 2019 ended up having Max Drawdowns ranked in the top 5 in 2020. Similarly, 4 out of 5 of the highest historical Rachev Ratios, had drawdowns that ranked in the last 5 positions of the drawdown.
In conclusion, Rachev Ratio can be used, together with other metrics, to incorporate non-parametric information about the distribution of returns in Asset Analysis and has some sort of predictive power towards future drawdowns. It is important to highlight how the ex-ante Rachev Ratio should be computed on a large number of observations as this will allow to incorporate a high number of extreme deviations from the mean.
AlternativeSoft provides a wide range of analytical tools for Asset Selection and Portfolio Management, including Rachev Ratio analysis across Peer Groups and Watchlists.
N.B. This article does not constitute any professional investment advice or recommendations to buy, sell, or hold any investments or investment products of any kind, and should be treated as more of an illustrative piece for educational purposes.
To trial a truly powerful and comprehensive analytic software for investment decisions, fund allocation, and our new, innovative digital due diligence visit alternativesoft.com , call us on +44 20 7510 2003, or email us information@alternativesoft.com
71 Carter Lane, London
EC4V 5EQ
+44 20 7510 2003