
AlternativeSoft’s Manual Portfolio Construction (MPC) solution makes it easy to see the impact of different investment allocations within a multi-strategy portfolio. Model portfolios built in the MPC allow for investors to determine how their investments can be expected to perform with allocations of varying risk (measured by volatility). Furthermore, this article also provides a “what-if” scenario to show the investor how the differently risked portfolios act if there is an allocation to the fund being marketed. This demonstrates how the AlternativeSoft’s MPC can enhance a multi-asset allocation portfolio.
Take a simple portfolio comprised of cash, equity, fixed income, and property exposure. Each simulates a range of risk tolerances from an investor’s point of view. As risk increases, gilts and cash exposure decrease as more weight is allocated to riskier assets.
Morningstar data is available in AlternativeSoft allowing investors to use iShares ETFs as proxies for each industry sector.
Table 1 shows the 10 multi-asset portfolios, with Portfolio 1 being the “least risky” and Portfolio 10 being “the riskiest”. None of the portfolios use leverage.
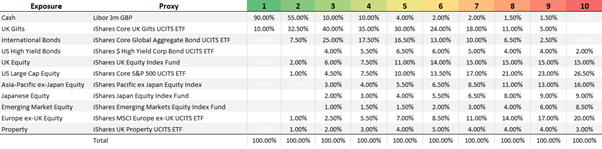
Table 1: Portfolio Weights increasing from 1-10 in risk
To calculate the 5-year expected portfolio time series requires capital market assumptions for each allocation within the portfolio.
Table 2 shows these assumptions (expected annualized return and volatility). These were calculated using the AlternativeSoft Asset Analysis solution. The estimated expected annual return and volatility are based on a 5-year (12m) rolling mean return and rolling maximum volatility.
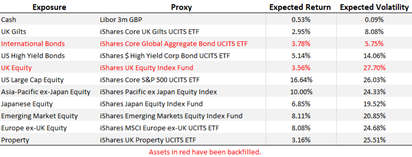
Table 2: Capital Market Assumptions
Having constructed the portfolios and applied capital market assumptions, the next step is to calculate expected outcomes.
This is done with AlternativeSoft’s MPC, which applies the asset weights (Table 1) and the capital market assumptions (Table 2) to one of AlternativeSoft’s proprietary algorithms. The result is a time series for each of the ten portfolios.
The calculation uses historical returns, meaning it is imperative that they are complete. For historical returns where there are gaps in the data, AlternativeSoft’s propriety model has been used to backfill the missing data.
Table 3 shows the 5-year expected portfolio statistics for each of the 10 portfolios, with risk increasing from left to right. As allocations to riskier assets increases, so does expected volatility, and expected return value.
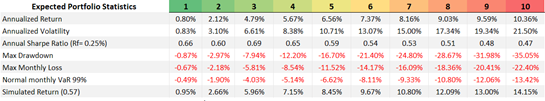
Table 3: 5-Year Expected Statistics for each Risk Portfolio
Figure 1 puts these expected portfolio statistics on a curve.
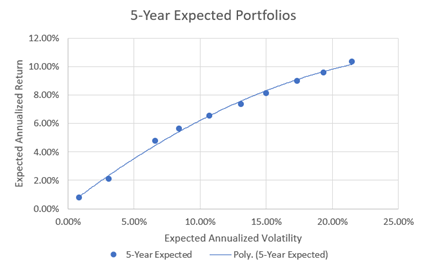
Figure 1: 5-Year Expected Portfolios
Having modelled 5-year expected outcomes the user can introduce a what-if. “What is the impact to the investor’s portfolio if they switch their US Large Cap Equity allocation to a US Large Cap Mutual Fund?”
Table 4 shows the ten portfolios following the aforementioned switch. The iShares Core S&P 500 UCITS ETF has been changed to US Large Cap Mutual Fund. The capital market assumptions for this US Large Cap Mutual Fund are calculated in the same way as before, giving an expected annualised return and volatility of 25.34% and 25.65% respectively.
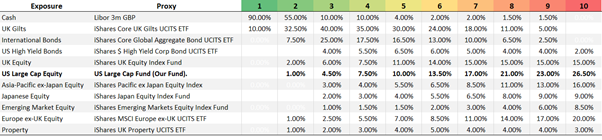
Table 4: Portfolio Weights (After substitution)
Table 4.1 shows that this change has improved the performance of each portfolio, across the risk spectrum. The highest risk portfolio (number 10) shows outperformance of 2.5% for 1.68% less risk, a 35% improvement in the Sharpe ratio. Overall, the extreme risk statistics have improved.
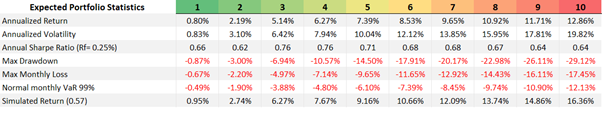
Table 4.1: Expected Portfolio Statistics – After substitution
The outperformance of the portfolios, because of this what-if adjustment, is clearly displayed in Figure 2.
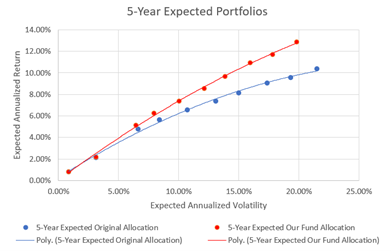
Figure 2: 5-Year Expected Portfolio Comparison of Allocations
This exercise demonstrates how easy it is to model investment portfolios with varying risk profiles, and to calculate expected returns by using the AlternativeSoft MPC. Modelling includes introducing what-if scenarios, giving the investor visibility on portfolio characteristics if they chose a different fund, such as funds an investor may be representing.
Another approach is to use the AlternativeSoft Dynamic Allocation solution. This allows the investor to see what impacts an allocation to an asset outside of the Strategic Asset Allocation can have on the portfolio. For example, they can see what the consequences are of adding another exposure line to the portfolio without having to remove exposures to other strategies in the portfolio.
The advantage of AlternativeSoft’s MPC and other tools is the ease of modelling alternative allocations and risk profiles, and the enormous time savings of analyzing portfolio impact of different combinations of investments. The goal of all disciplined and top performing investors is to make informed decisions about their fund choices and to maximize the returns to their client with the least amount of risk.
N.B. This article does not constitute any professional investment advice or recommendations to buy, sell, or hold any investments or investment products of any kind, and should be treated as more of an illustrative piece for educational purposes.
To trial a truly powerful and comprehensive analytic software for investment decisions, fund allocation, and our new, innovative digital due diligence visit alternativesoft.com , call us on +44 20 7510 2003, or email us information@alternativesoft.com
71 Carter Lane, London
EC4V 5EQ
+44 20 7510 2003