
A frequent mistake when using predicting models is to over-stress the importance of R-squared, this can often lead to the problem of overfitting.
This phenomenon occurs when the number of the parameters is increased to a point where, despite the in-sample errors are being minimised the model begins to lose its ability to predict using out-of-sample data.
Let us take a sample of n observations, as the number of regressors k increases towards n, the ability of the model to predict in-sample values of the dependent variable will increase, such that when k=n the model will perfectly fit the data.

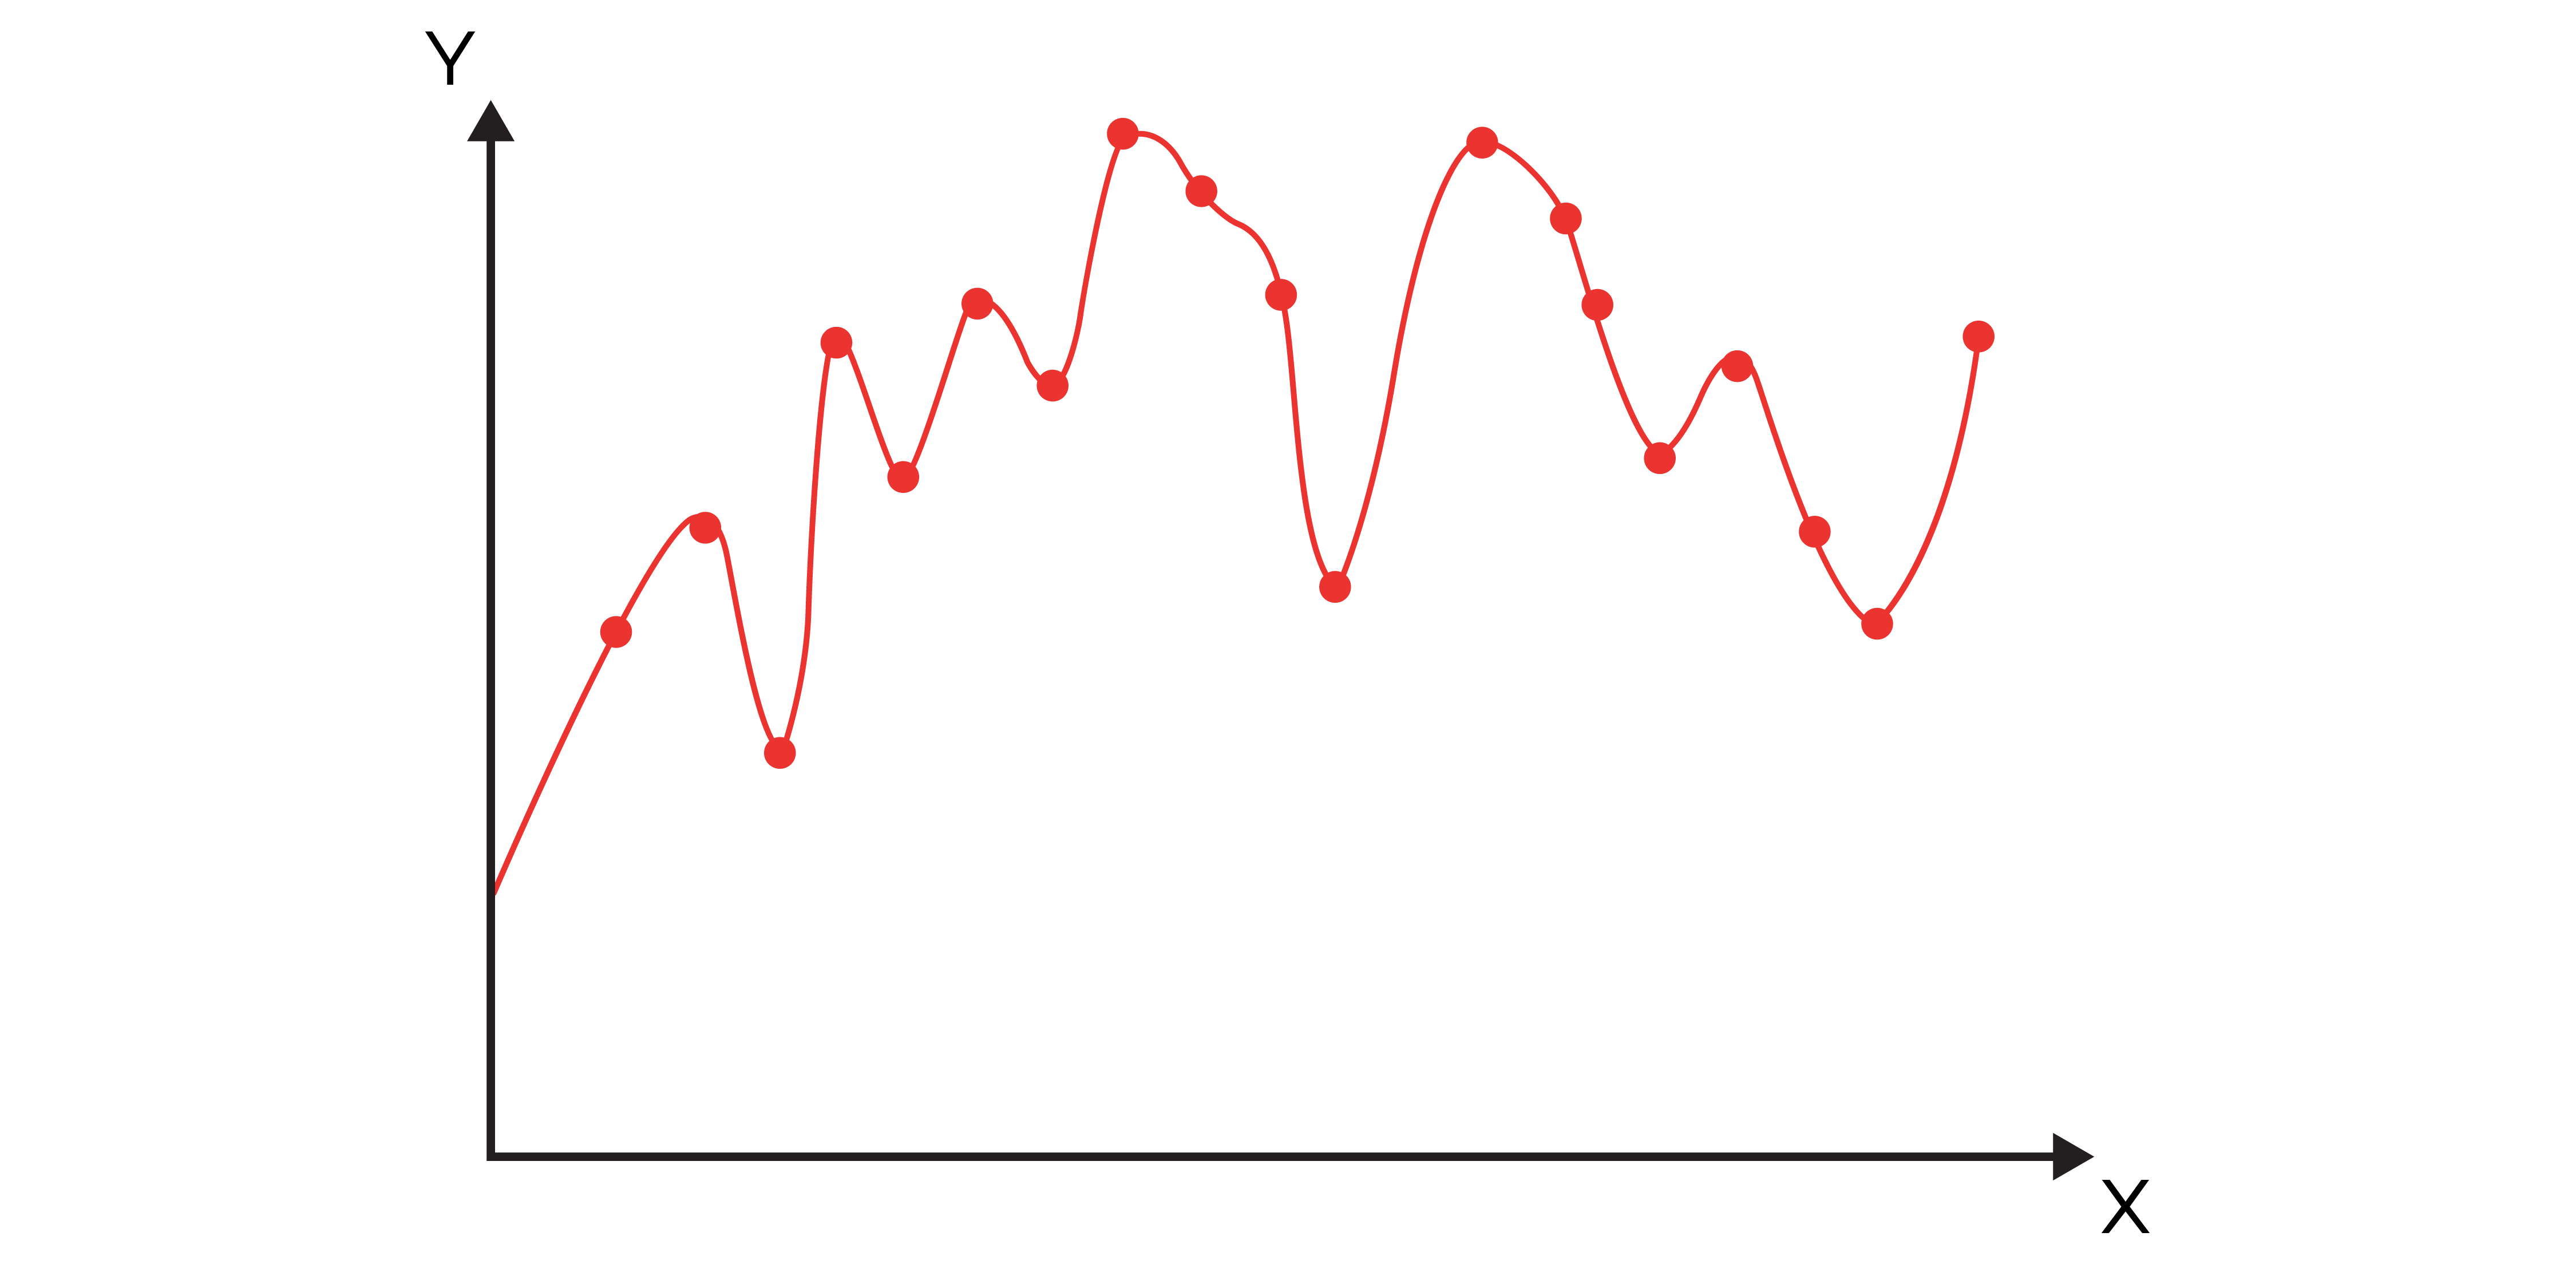
While the above regression might be able to fully explain the variation of the data sampled, it will clearly be less effective when predicting using new observations.
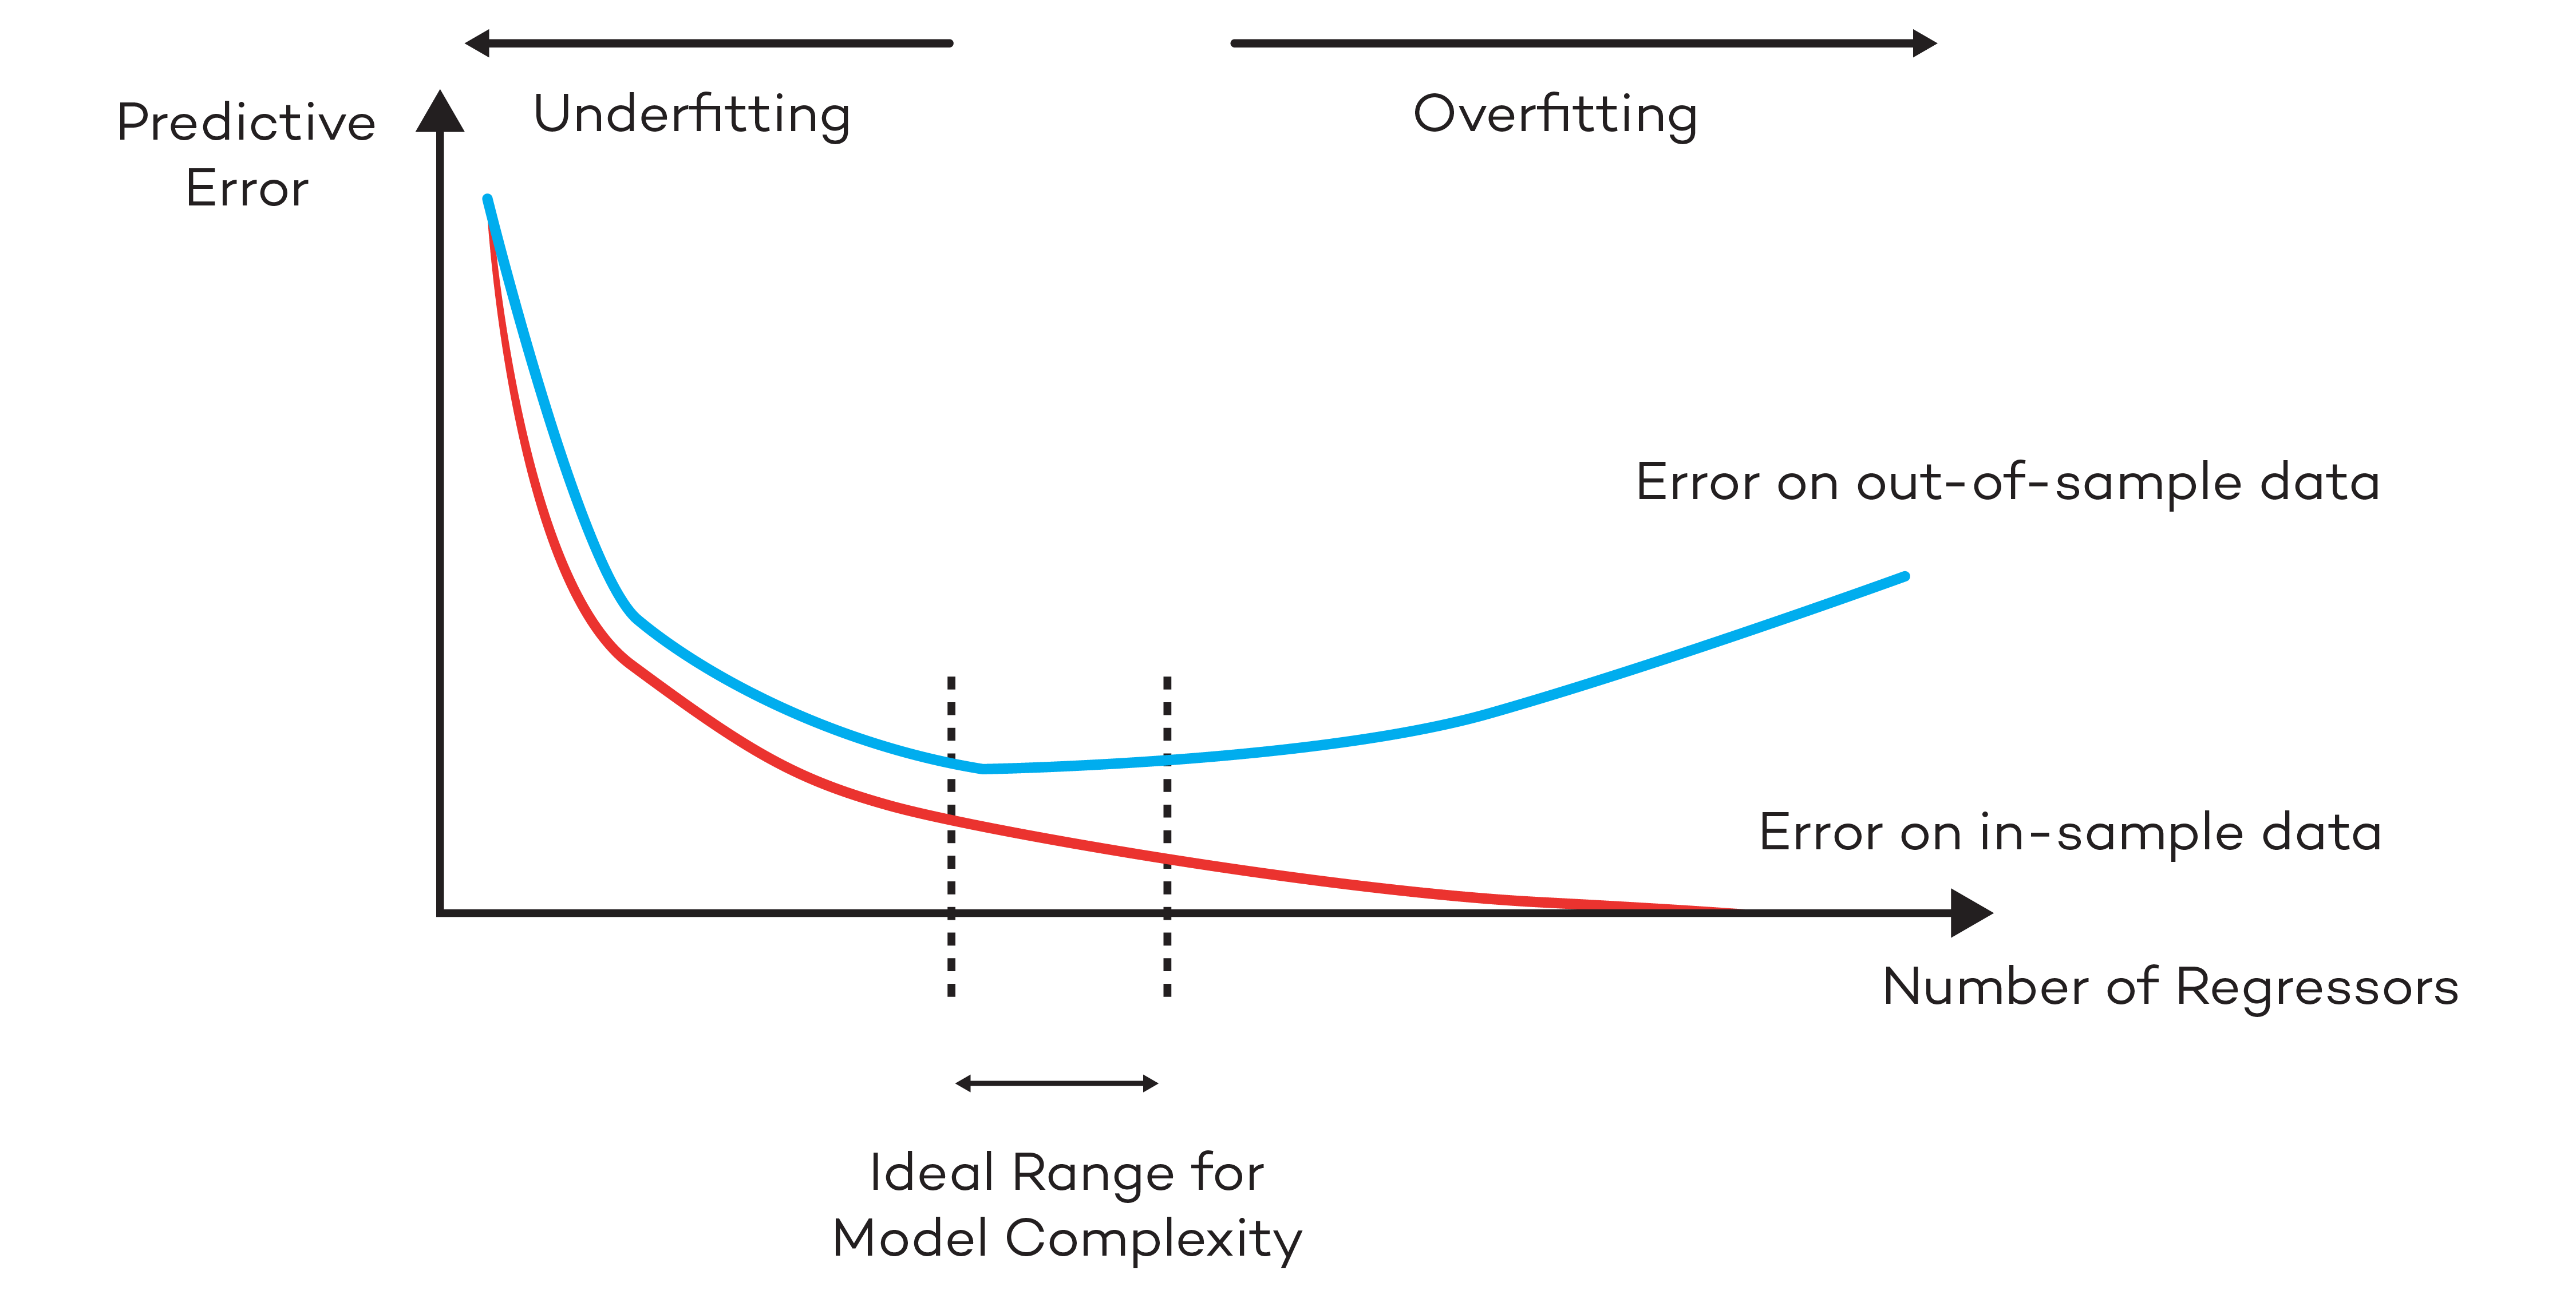
The graph above shows how, as we increase the number of regressors (i.e., the complexity of the model), the estimated betas will excel at minimizing errors of the sample however will fail to do so when used on out-of-sample data.
A way to avoid superfluous regressors from eroding the degrees of freedom of a regression is to use measures like Adjusted R-Squared to quantify the goodness of the fit. The latter introduces a penalty each new explanatory variables. The Adjusted R-Squared only increases when the new regressor adds sufficient explanatory power that justifies its inclusion. Another way to avoid overfitting would be to only include factors that have p-values lower than 0.05 (or 0.10).
In conclusion, it is important to be parsimonious with the number of independent variables. While it might appear that more factors will lead to a better regression, it is essential to consider other the negative impacts that overfitting will have on the predictive power of the model. Although there are numerous ways to select the correct number of regressors, a common practice is to aim to maximise the Adjusted R-Squared of the regression. This allows to minimise the error for out-of-sample data prediction.
Thanks to the Stepwise Regression available on AlternativeSoft, it is possible to maximise the Adjusted R-Squared; for any given set of potential factors, the software will automatically rule out any redundant regressor.
N.B. This article does not constitute any professional investment advice or recommendations to buy, sell, or hold any investments or investment products of any kind, and should be treated as more of an illustrative piece for educational purposes.
To trial a truly powerful and comprehensive analytic software for investment decisions, fund allocation, and our new, innovative digital due diligence visit alternativesoft.com , call us on +44 20 7510 2003, or email us information@alternativesoft.com