
Turbulence In Europe – CTA Allocation for a European Investor
Over the past week the world has been watching as continental Europe sees its first war between developed nations since the Second World War. On the 24th of February, the Russian army began its “Special Operation” in Eastern Ukraine, and it quickly became apparent that these operations would not be limited to the Donbas region.
Markets
Markets initially reacted violently to the news with Emerging Market equities down -2.49%, Europe (ex. UK) equities down -2.97%, and UK Equities down -4.02%; except for the S&P 500 (up 1.50%). Treasury yields were initially pushed lower by investors wishing to see the impact the action had on global equities. However, since last week the equity market has somewhat stabilised with near neutral 1-week returns for UK Equities,
Long-term economic sanctions have been placed on Russia, and Belarus, which will no doubt have a knock-on effect on global financial markets. Most importantly we have seen banks removed from SWIFT, assets seized, asset managers selling off Russian assets, and companies boycotting Russia. This includes Maersk, and other key shipping firms, who have suspended deliveries to the country.
Commodities
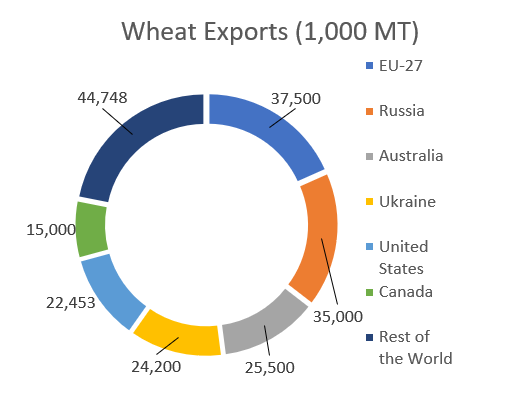
Early on in this war we can see the impact on commodities with record high values across the board. Both Ukraine and Russia are key players in global commodities markets. Russia is a member of OPEC and supplies Europe with 41% of its natural gas requirements1. Both countries are responsible for around 30%2 of the world’s wheat exports, 40-50%2 of the world’s Neon exports, 40%2 of the world’s Palladium is produced in Russia, and both countries account for roughly 20%2 of the world’s corn trade. Ukraine alone is responsible for 16% of the world’s corn exports.
Figure 1: Global Corn Exports (1,000 MT)3
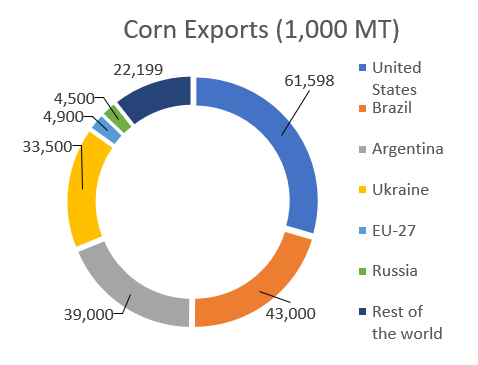
Figure 2: Global Wheat Exports (1,000 MT)3
It appears that a prolonged war and sanctions may have significant global inflationary impact with many of the commodities mentioned being direct – or indirect – consumer staples. As the prices of these commodities fluctuate, we would expect CTA / Managed Futures strategies to be able to capture the upside in the commodities market.
Portfolio Impact
Investors will be calculating the long-term effect of these measures on portfolios and trying to protect themselves from downside risks. We theorise that a portfolio with exposure to CTA Hedge Fund strategies (or direct commodity exposure) will be able to weather the current climate better than a portfolio with limited alternatives exposure.
To test this theory, we have created a portfolio from a European lens using AlternativeSoft. This portfolio holds equity, fixed income, and cash positions at an asset class level. We will assess the portfolio over a 5-year window.
Table 1 – Allocation
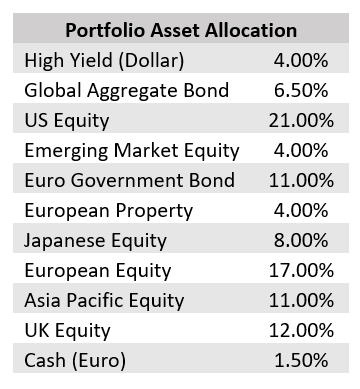
We will measure the portfolio’s historical and expected statistics, as well as how the portfolio will behave in the market described above. To achieve this, a factor set is created which has major global markets and a commodities basket. Using AlternativeSoft’s stress-testing module, we will stress these markets (add their 1-month February return) and see what impact this has on our base portfolio.
Table 2 – Statistics
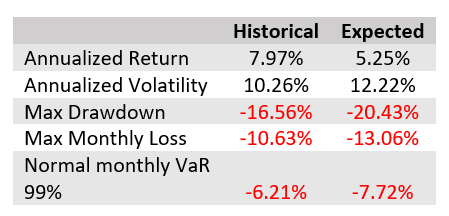
The expected portfolio statistics were computed using Blackrock Investment Institute’s capital market assumptions4 for our asset classes. The portfolio has historically outperformed what we expect the next 5-years to yield for the investor.
We will now conduct a multi-factor stress test to simulate how the portfolio would perform in our “war conditions”. A factor set consisting of commodities and certain markets has been used for this exercise. We have “shocked” the markets by introducing the February returns for each factor in our multi-factor stress test scenario. The result for our base portfolio is as follows:
Table 3 – Stressed
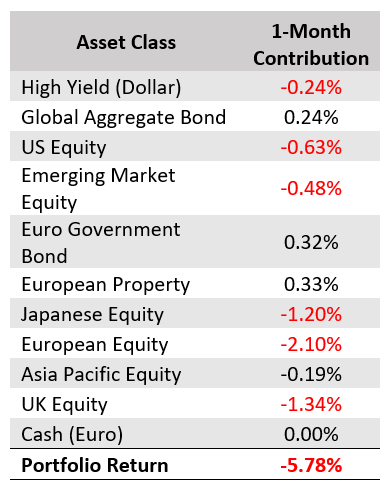
Our portfolio has a -5.78% loss in February based on the multi-factor stress test results. Can we improve the portfolio statistics and performance in the stressed scenario by allocating a portion of the portfolio to a CTA hedge fund strategy?
Portfolio With CTA Exposure
Using AlternativeSoft’s manual portfolio construction module, we will adjust the portfolio so that there is a 5% allocation to the Eurekahedge CTA/Managed Futures Hedge Fund Index, we will also reduce the cash position to 0 and rebalance all the other allocations.
Table 4 – Allocation

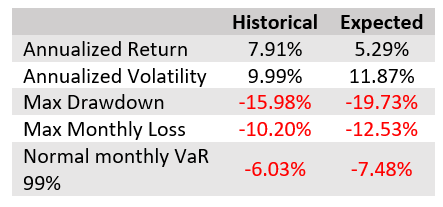
The new statistics for the portfolio show a slightly improved expected performance with slight protection from extreme risks. There is also an improved return for the risk taken.
Table 5 – Statistics
How does our portfolio perform in the stressed scenario? As before, we have taken the factor set and stressed the returns for February. The one-month contributions can be seen in Table 6. It is important to note that the Portfolio Return does not equal the sum of the contributions, as we treat the portfolio as a separate time-series impacted by the same factor set.
Table 6 – Stressed
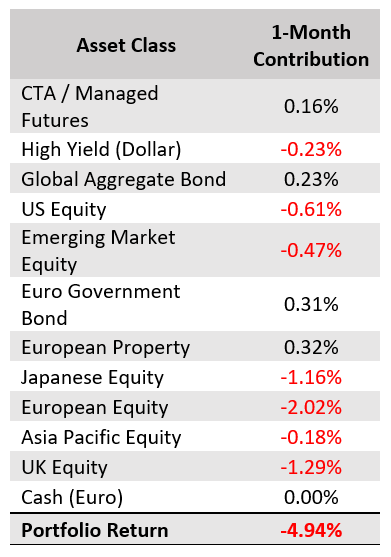
The one-month contributions show that our CTA Managed Futures strategy has a positive-weighted stressed return. The portfolio stressed return has also considerably changed. Although, we would have expected higher benefit from the added CTA / Managed Futures allocation.
Conclusion
In conclusion, we have constructed a European portfolio and calculated the expected portfolio conditions. In response to an extreme market scenario, we have added an allocation to CTA / Managed Futures in the hope of hedging some of our risk and capturing returns in the commodity markets. Both portfolios have been stress tested to compare their performance during the war. We find that the CTA allocation helps to improve portfolio return during periods of stress. We expect better performance from the identification and selection of an appropriate manager as we have used a benchmark as a proxy. This article also assumes that the investor is not using complex hedging tools to protect from market uncertainty.
References
1 https://ec.europa.eu/eurostat/cache/infographs/energy/bloc-2c.html#carouselControls?lang=en
2 https://tradingeconomics.com/commodity
3 https://www.indexmundi.com/agriculture/
4https://www.blackrock.com/institutions/en-gb/insights/charts/capital-market-assumptions