

Disruptive events such as wars generally alter the risk and return characteristics of asset classes. These events also change asset class correlations and the way asset managers set their asset allocation strategies [1]. The Russia-Ukraine conflict has significantly affected the world’s financial markets. Subsequentially, one would expect hedge fund returns to be impacted. It is also important to ascertain which strategies perform better before and after the conflict and if this has significantly changed because of the event.
AlternativeSoft’s analytical platform is used to carry out a study spanning from Aug 2021 to July 2022. This period is split into pre-invasion (Aug 2021 to Jan 2022) and post-invasion (Feb 2022 to July 2022) periods. The study addresses whether there has been a significant shift in the performance of hedge funds, and if so, in what direction. The investment universe is comprised of 400 hedge funds with varying strategies. The funds analysed have existed throughout the entirety of the period [2].
To better evaluate the performance of the selected hedge funds, it is necessary to understand the dynamics of different asset classes during the analysis period. The return, risk, and correlation characteristics of the 4 main asset classes including equities, fixed incomes, commodities, and hedge funds have been analysed using AlternativeSoft. During the year-long period, all the asset classes showed negative returns except the commodities market. The selected equity market index (S&P500) lost 8.68% of its value from Aug 2021 to July 2022. The return for the fixed income index (Barclays Capital U.S. Aggregate Bond Index) and hedge fund index (HFRI fund weighted composite index) was -14.23%, and -4.01% respectively. The commodity market, represented via the S&P GSCI index increased 31.34% during the sample period (Aug 2021 to July 2022). The trend started before the war, and it continued to grow after the invasion. All other asset classes experienced bearish markets before the conflict, and this further deteriorated after the conflict began.
From a risk perspective, not only did the volatility of all the asset classes increase after the conflict, but the correlation between these asset classes also changed. This is not surprising and is supported by empirical studies of financial markets.
Tables 1 and 2 show the correlation matrices amongst the asset classes before and after the conflict.
| Equity | Fixed Income | Commodities | Hedge Funds | |
|---|---|---|---|---|
| Equity | 1.00 | |||
| Fixed Income | -0.12 | 1.00 | ||
| Commodities | 0.02 | -0.76 | 1.00 | |
| Hedge Fund | 0.27 | 0.61 | -0.24 | 1.00 |
| Equity | Fixed Income | Commodities | Hedge Funds | |
|---|---|---|---|---|
| Equity | 1.00 | |||
| Fixed Income | 0.86 | 1.00 | ||
| Commodities | -0.13 | -0.39 | 1.00 | |
| Hedge Fund | 0.92 | 0.75 | 0.19 | 1.00 |
The matrices show that the correlation between equities and fixed income returns has changed significantly due to the war. A relatively weak negative correlation of -0.12 between two asset classes has turned into a strong and positive relationship in which 86% of variations of one asset class can be explained by the return variations of the other one. The inflationary situation of the economy after the war has changed the dynamics of bond markets considerably, due to changes in the interest rates to fight inflation as well as shifts and twists in yield curves. The nature of fixed income investments makes them unattractive in high-interest rates environments. Equity markets have also faced shifts in the way they are being evaluated after the conflict. This market has experienced a money flight from growth investments. Therefore, both markets have experienced negative returns whilst also becoming more correlated to each other.
Another significant change observed is the correlation between commodities and hedge funds returns. Before the conflict, this relationship was adverse, so hedge funds’ returns used to covary commodities return negatively. After the conflict, a positive relationship emerged.
Using AlternativeSoft, the average annualised returns for all the funds have been calculated and compared before and after the war. Table 3 and Chart 1 indicate the comparison between the two periods, after clustering the results based on the hedge funds’ strategies.
| Average Annualised Return | ||
|---|---|---|
| Before the Conflict | After the Conflict | |
| CTA/Managed Futures | 5.20% | 17.88% |
| Macro | 0.41% | 8.99% |
| Diversified Debt | 4.36% | 3.21% |
| Arbitrage | -3.13% | 0.86% |
| Distressed Debt | 2.27% | -0.72% |
| Multi-Strategy | 0.96% | -2.50% |
| Relative Value | 2.44% | -3.21% |
| Fixed Income | -1.53% | -4.94% |
| Value | -1.84% | -6.52% |
| Long Short Equities | -4.56% | -8.48% |
| Dual Approach | 3.36% | -10.35% |
| Bottom-Up | -7.05% | -15.67% |
| Event Driven | 0.23% | -18.98% |
| Total Average | -0.62% | -1.86% |
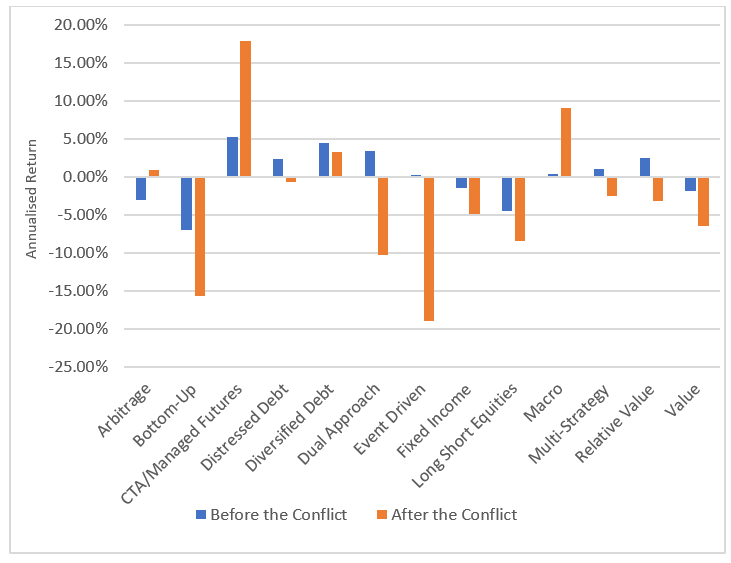
The best-performing strategy both before and after the conflict began is CTA/Managed Futures, and the worst performances are the Bottom-Up and Event-Driven strategies, before and after the war respectively.
The outperformance of the CTA/Managed Futures strategy is not surprising. It is intuitive that with the inflationary situation following disrupted supply chains induced by the covid and deteriorated by the war, rising interest rates, and bearish equity markets, Commodity Trading Advisor (CTA) funds have access to new sources of return. The energy supply shock has caused commodity prices to soar, and CTAs captured such returns. Highly liquid futures contracts allow CTA/Managed futures funds the flexibility to incorporate a wide range of investment strategies. These funds have traditionally demonstrated natural positive skewness that has been useful during stressed markets [3].
The underperformance of the Event-Driven strategy could be attributed to the stressed equity markets post-invasion. This strategy takes positions in corporate securities to benefit from M&As, re-organisations, capital restructuring, and so on mostly using leverages. Both unstable equity markets and an increasing trend of cost of leverage could potentially cause the underperformance of the Event-Driven strategy.
Macro strategies have also gained a relatively strong return of 8.99% (annualised) after the outbreak of the war while its annualised return in the period before the war was only 0.41%. The strategy implementation in macro hedge funds is not too different from that of the CTAs except that macro strategy adopts more thematic investment principles.
Fixed income strategies are also among the underperforming strategies. Inflation erodes the purchasing power of future cash flows, spelling bad news for the bond market as a whole. As yields change, fixed coupons pay, relatively speaking, less in the new high-yield environment. Resultantly, fixed-income instruments lose their value in the market. Generally speaking, this rhetoric applies to the wider bond market. However, it will vary from one fixed income instrument to another based on factors such as the nature of their coupon payments, i.e., whether the payments are linked to inflation or not, and other factors including the bonds’ duration, meaning the sensitivity of the bonds’ prices to the interest rates changes, and the convexity of their yield. Convexity refers to the degree to which the sensitivity of a bond yield is curved and how it changes when interest rates change. Instruments whose coupons are inflation-protected (such as Treasury Inflation-Protected Securities) or instruments with low sensitivity to the interest rates rises may weather the storm.
One important observation is that although the average return of all the funds has decreased due to the conflict, from -0.62% to -1.85%, even during the periods before the war, this performance had started to weaken. Some of the main reasons could include the already disrupted global supply chains due to COVID-19, the political tone and narrative before the war, and expected inflation because of the expansionary policies of the central banks and stimulus packages introduced to the economy.
Both the pre- and post-invasion periods could be considered bearish as the S&P500 index has lost 8.7% of its value in the entire one-year period. However, in a similar period, the selected hedge funds have exhibited a -1.95% average annual return [4].
To assess the performance of hedge funds more precisely it is necessary to take their volatility into account. Chart 2 indicates the comparison of hedge fund strategies between the two periods.
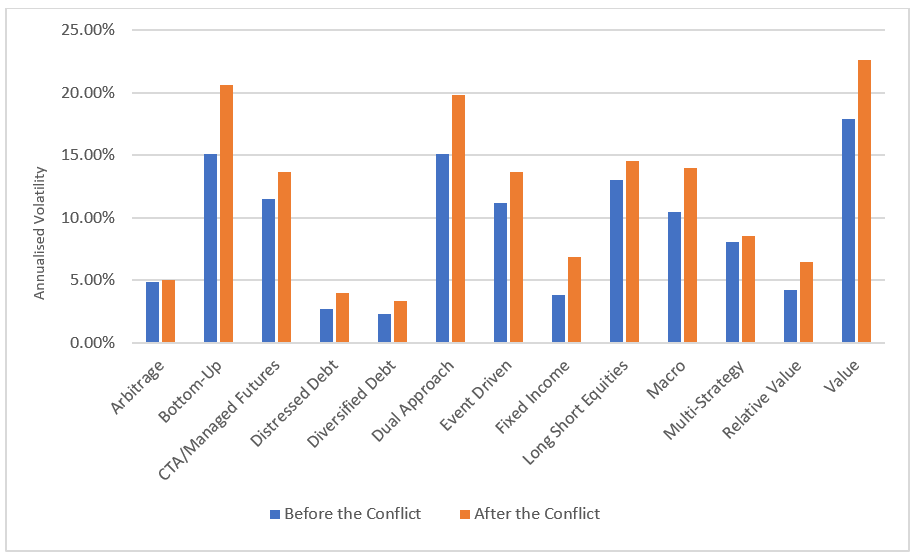
While the volatility of almost all strategies has risen after the territorial occupation, the most affected strategies are Value, Dual Approach, and Bottom-Up. The majority of the impacted hedge funds implement their strategies using equity instruments. The increasing volatility of these funds can be explained by the increasing volatility of their underlyings.
A wise question here could be what about the extreme risk event metrics? We used AlternativeSoft to run a Maximum Drawdown analysis on the funds after grouping them based on their strategies to see what the maximum observed peak to trough loss is. All strategies have faced significant increases in their Maximum Drawdown after the conflict. Amongst the most impacted strategies are Dual Approach, Bottom-Up and Event-Driven strategies, mostly again implemented using equity markets. Maximum Drawdown is an indicator of downside risk over a specified period and the result of this analysis supports what was observed in the markets after the conflict. Chart 3 shows the comparison between hedge funds Maximum Drawdown based on strategy before and after the conflict.
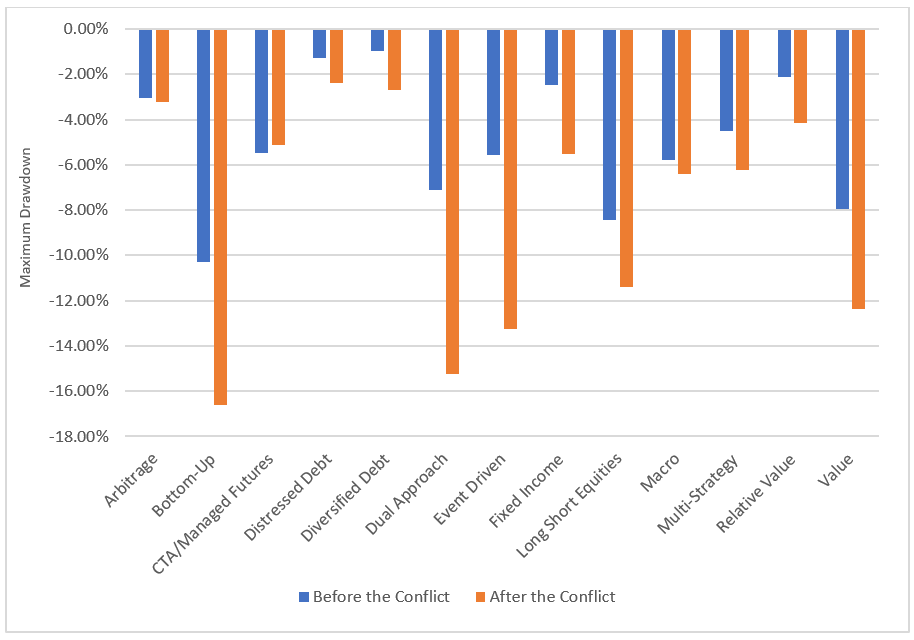
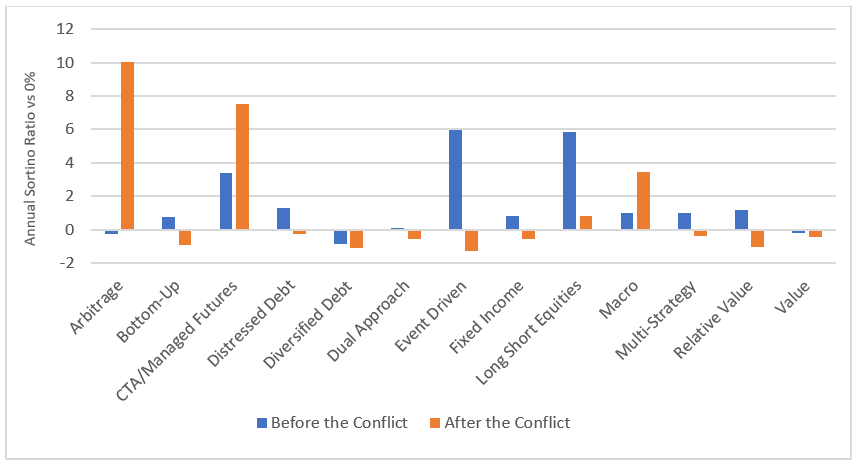
Chart 4 also indicates the comparison between hedge funds’ Sortino ratio based on strategy before and after the conflict. The results for the Sortino ratio show that Arbitrage strategies outperform any other strategy in the hedge fund sector after the conflict. It is obvious that arbitrage strategies carry high levels of volatility risk, but AlternativeSoft’s analysis shows that if we just take the negative volatility as an element of penalty for the funds, the arbitrage funds are doing well. In the selected period, they hedge against negative volatility, exploit opportunities for positive risks, and get rewarded for exposing them to good risks.
To better take both return and risk metrics of the hedge funds into the account, Chart 5 indicates the comparison between hedge funds’ Jenson’s Alpha based on their strategy before and after the conflict. Jenson’s Alpha is a good indicator of asset management performance evaluation. It measures the degree to which the fund managers are skilled after adjusting their performance based on the broad market returns and the risk factors they are exposed to. The selected benchmark is the HFRI Fund Weighted Composite Index.
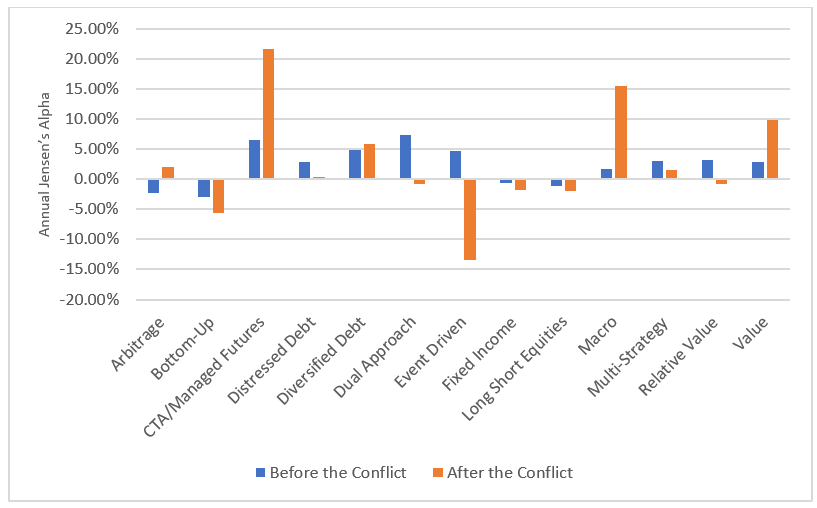
This again supports the results of other indicators throughout the research so that the CTA/Managed Futures and Macro strategies are the best performing strategies after the war. Value strategies are also performing well based on their post-war Jenson’s Alpha.
This implies that these fund managers generate significantly positive alphas compared to the sector’s benchmark, specifically after the war. This extreme outperformance is unlikely to be explained by market conditions and pure luck. It can be attributed to the fund managers’ skills during the analysis period.
In this article, we used AlternativeSoft to analyse the performance of different hedge fund strategies during a period of war. We used two 6-month intervals, one before and one after the conflict between Russia and Ukraine. The research confirmed that the conflict has been causing some disruptions in hedge funds’ strategy implementation by affecting each differently. The findings indicate that the hedge fund sector is fragmented and heterogeneous meaning that different strategies in different market situations result in various investment pay-offs. This again supports the fact that well-conducted research is necessary to exploit the sector opportunities.
The correlation matrices during the periods before and after conflict have also been compared in this research. The result is that some asset classes have posed a significant shift in terms of their correlation with different asset classes.
Despite these effects, the research results show that the war has not caused a structural shift in the sector. Instead, it has added another disruptive influence on the background factors and exacerbated previous market stresses associated with the coronavirus pandemic of 2020 and expansionary monetary and fiscal policies.
The best performing strategy both before and after the war was CTA/Managed futures for the following three reasons: first, their flexibility to incorporate a wide range of investment strategies; second, the highly liquid nature of the underlying contracts; and third, rising commodity prices due to supply chain disruptions. The results support the previous applied research conducted by AlternativeSoft in terms of CTA/Managed futures hedge funds strategies [5]. The worst-performing strategies were related to those conducted using equity and fixed income instruments. The main reason was that their underlying securities had negative returns during the analysis period and it deteriorated further by the conflict.
[1] K. Oosterlinck, A. Reyns, and A. Szafarz, “Gold, Bitcoin, and Portfolio Diversification: Lessons from the Ukrainian War,” Work. Pap. CEB, vol. 22, 2022.
[2] The database used for the analysis is Eurekahedge and the frequency of the data is monthly.
[3] H. H. Lean, K. F. Phoon, and W.-K. Wong, “Stochastic dominance analysis of CTA funds,” Rev. Quant. Finance Account., vol. 40, no. 1, pp. 155–170, 2013.
[4] Calculated using AlternativeSoft
[5] https://resources.alternativesoft.com/cta-hedge-funds-when-is-the-right-time-to-enter
AlternativeSoft is a complete solution that allows managers to simplify and make efficient the quantitative analysis involved with asset selection, portfolio construction, analysis, and management.
To trial a truly powerful and comprehensive analytic software for investment decisions, fund allocation, and our new, innovative digital due diligence visit alternativesoft.com , call us on USA: +1 630 632 5777, UK: +44 20 7510 2003, or email us information@alternativesoft.com
N.B. This article does not constitute any professional investment advice or recommendations to buy, sell, or hold any investments or investment products of any kind, and should be treated as more of an illustrative piece for educational purposes.
UK: 10 Lower Thames Street, London
EC3R 6AF
USA: +1 630 632 5777