

With inflation and interest rates rising and equity markets showing signs of instability, investors are increasingly looking at Commodity Trading Advisor (CTA) funds as an alternative source of return. CTAs aim to achieve their investment objectives through the trading of futures.
During the 2008 financial crisis CTAs proved to be a shining star amongst the hedge fund space. Where other strategies experienced waves of redemptions, CTAs delivered strong performance, liquidity, and diversification. In the following years, inflows in the strategy strengthened and investors came to view CTAs as a “must-have element” of any portfolio. These were the golden years.
As time went on, however, interest in CTAs waned. Equity markets had their greatest rally ever, and investor enthusiasm soon transitioned to equity investments and away from CTAs. Once the darling of any investor’s portfolio; CTAs now did not even get a seat at the table. Why should they? Central banks, determined to never let another 2008 happen again, amped up regulatory protections and interventions, in response to potential threats of future crises.
But what if CTAs are still relevant? In a world still struggling with the impacts of the Covid-19 pandemic, rising inflation, and the prospect of rate hikes, CTAs could still play an important role in the portfolios of allocators across the globe. In this article, we evaluate the effectiveness of CTA funds as a diversifier when compared to the returns of equity markets. We will also investigate whether CTA funds tend to do better after a period of positive return (momentum strategy) or after a period of poor performance (contrarian strategy). We find that CTAs do indeed provide protection in the form of diversification during periods of downturn, and that CTA strategies are most effectively invested into as part of a contrarian strategy.
Diversification is arguably the most important factor that allocators consider when deciding whether or to include CTA strategies in their portfolio. When evaluating the diversification power of a particular asset or strategy against another, the standard approach is to compute correlations. It is well known that in periods of heightened market volatility, correlations between returns on assets/strategies tend to increase relative to correlations estimated during periods of normal volatility. In order to get a fair observation of the diversification effect of CTAs we will evaluate them during two independent scenarios:
Bullish periods of S&P 500 Index
Positive return periods of the S&P 500 from Jan 2000 to Dec 2021.
Bearish periods of S&P 500 Index
Negative return periods of the S&P 500 from Jan 2000 to Dec 2021.
Table 1 – Barclay CTA Index metrics during bull periods of the S&P 500 Index between (Jan 2000 to Dec 2021)
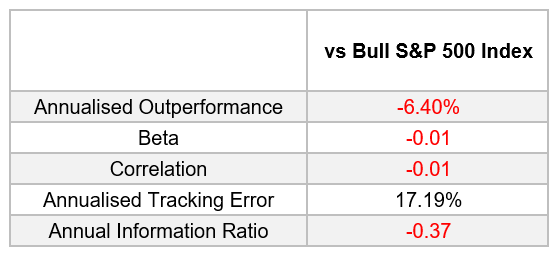
Source:AlternativeSoft, BarclayHedge
Table 2 – Barclay CTA Index metrics during bear periods of the S&P 500 Index between (Jan 2000 to Dec 2021)
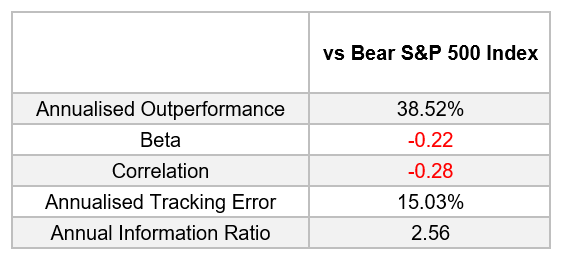
Source: AlternativeSoft, BarclayHedge
The negative value of the Beta and Correlations for the Barclay CTA index vs S&P 500 during the bearish periods highlights the great potential that this strategy has for diversifying against severe downturns in equity markets.
Analysing CTA performance during severe equity market drawdowns also supports the argument for including CTA strategies within portfolios as a method of risk management through diversification. When we look at the worst 5 drawdowns of the S&P 500 Index and compare the relative performance of the Barclay CTA Index, during the worst three drawdowns CTA funds have generated positive returns, and during the 4th and 5th worst drawdowns, CTA strategies provided substantial downside protection from unfavourable market conditions.
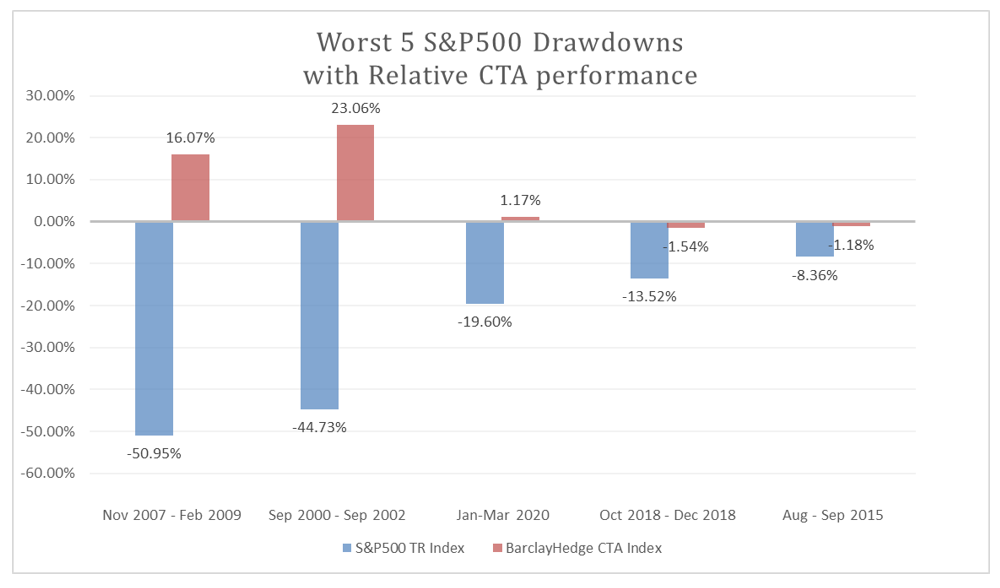
Graph 1: Worst 5 Drawdowns S&P 500 and relative Barclay CTA Index performance; Source: AlternativeSoft, BarclayHedge
CTAs have shown to be a good diversifier against equities during periods of market stress. In some cases, even generating strong positive performance.
We want to now determine whether a momentum or a contrarian-based strategy should be used when investing in CTAs. For this analysis, we found the 10 highest and 10 lowest monthly returns of the Barclay CTA index and calculated the following 6 month return after each of these high and low points. A period of positive returns after a drawdown suggests a contrarian approach is the best strategy to employ when investing in CTAs, whereas a period of positive returns after a rally would suggest that a momentum-based strategy is the more profitable approach.
The results are shown in Table 3 and 4.
Table 3 - 6-months cumulative returns of Barclay CTA Index after a top 10 return
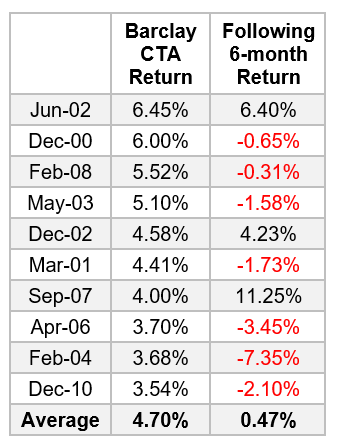
Source: AlternativeSoft, BarclayHedge
Table 4 - 6-months cumulative returns of Barclay CTA Index after a bottom 10 return
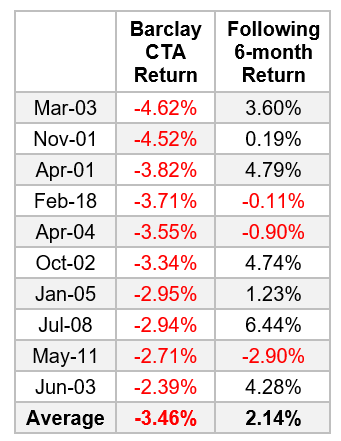
Source: AlternativeSoft, BarclayHedge
Tables 3 and 4 show that, on average, CTA funds perform better in the 6 months after a substantial loss. On average a contrarian-based strategy for investing in CTAs generates a 2.14% return in the following 6 months of a drawdown, compared to a paltry 0.47% return in the 6 months that follow a CTA investment after a rally.
In conclusion, CTA funds provide a useful source of diversification during large S&P 500 drawdown periods and during the subsequent 6 months following a large 1-month Barclay CTA monthly loss. Therefore given the evidence we find that CTA funds provide adequate diversification during periods of stress as well showing the ability to recover easily themselves from periods of negative return; making them a useful addition to any portfolio.
All analysis for this article was completed using the Alternative platform. AlternativeSoft solutions allow investors to easily screen through large CTA datasets. AlternativeSoft users able to find funds that provide protection during large S&P 500 drawdowns and offer diversification during periods of stress. Using AlternativeSoft’s award winning analytical capabilities allows users to conduct in-depth back testing to determine the best trading strategies, which leads to superior portfolio performance.
N.B. This article does not constitute any professional investment advice or recommendations to buy, sell, or hold any investments or investment products of any kind, and should be treated as more of an illustrative piece for educational purposes.
To trial a truly powerful and comprehensive analytic software for investment decisions, fund allocation, and our new, innovative digital due diligence visit alternativesoft.com , call us on UK: +44 (0)20 7510 2003 / USA: +1 630 632 5777, or email us information@alternativesoft.com
UK: 10 Lower Thames Street, London
EC3R 6AF
USA: +1 630 632 5777