
“Was 2018 really as bad a year for Hedge Funds as most market commentators have suggested and, if so, which strategies would have been best insulated from the turbulence?”
As we come into the New Year, our clients and industry peers have regularly mentioned their disappointment in how hedge funds have performed over the past 12 months. We have decided to take a closer look to see how accurate this investor sentiment is and explore which hedge fund strategies felt the effects the least and most.
We will look at assets under management (AUM) and drawdown data. This data has been analysed cross-sectionally by strategy, fund size, and investment geography to try to give a comprehensive picture of hedge fund behaviour. It is worth noting that dead funds were included in the analysis to avoid survival bias.
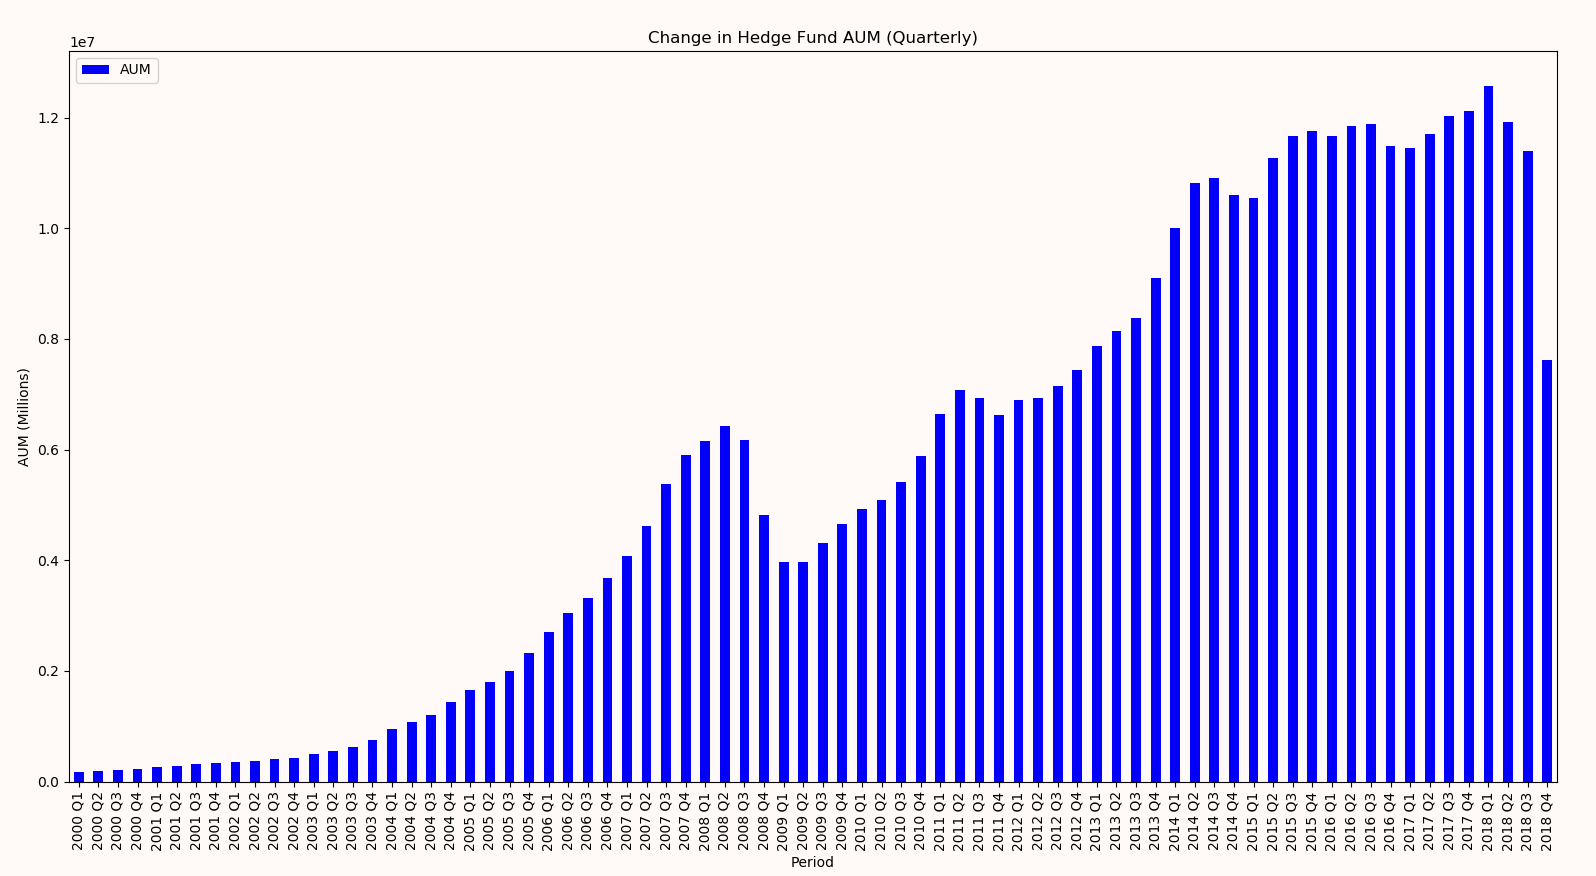
Figure 1: Change in hedge fund assets under management Q1 2000 – Q4 2018.
Data provided by Eurekahedge.
Figure 1 shows quarterly hedge fund AUM since 2000. The graph describes a steep increase in fund AUM from Q1 2000 until Q2 2008 when we start to see the effects of the global financial crises on hedge funds. The chart shows that in late 2009 recovery begins, and we see steady growth, with some peaks and troughs, until Q1 2018 where we reach a ‘peak’.
Although there appears to be a peak at the beginning of 2018 we can see a sharp drop off quarter-by-quarter throughout the year. There is a considerable change in hedge fund AUM Q4 2018 which would signal an extremely negative investor sentiment. It is however worth mentioning that, due to the unregulated nature of hedge funds, the AUM data may not have been fully reported yet by every fund in the month of December. AUM will also be a slightly lagging indicator due to stringent liquidity conditions.
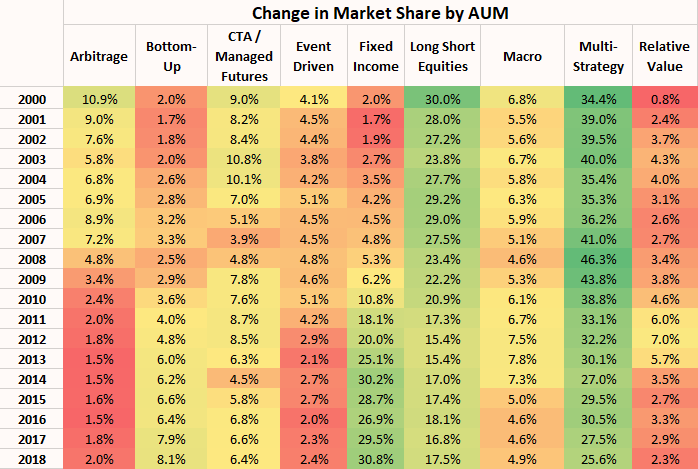
Table 1: Percentage Change in Market Share (AUM)
Data provided by Eurekahedge.
Table 1 breaks down change in relative market share between eight of the major hedge fund strategies. It shows that both the Arbitrage and Event Driven strategies have seen a decrease in popularity from 2000-2019. The table also shows that there has been a slight reduction in appetite for Long Short Equity strategies over time which may be accounted for by the longest equity bull run in history occurring during that period. CTA / Managed Futures, Macro, and Relative Value strategies seem to see a constant market share across time with a couple of fluctuations, most notably 2011-2013 for Relative Value. Interestingly, this table shows that there has been a massive increase in AUM for Fixed Income and Bottom-Up hedge funds, relative to the other strategies, over the past 18 years. We can use AUM as a proxy to see how investors’ appetites have changed over the past 18 years, but does our drawdown data match the investor sentiment?
Using an algorithmic asset search we have managed to find the time at which each hedge fund had their maximum drawdown. This data was then aggregated by strategy, year, and investment geography.
Table 2, shows the location and frequency of the maximum drawdown for each strategy by year and investment geography. For example, we can see for the year 2018 27.12% of drawdowns came from Long-Short Equity hedge funds in Developed Markets. We can also interpret that Long-Short Equity hedge funds were the most common source of drawdowns in the period 2000-2018 and can see that CTA / Managed Future funds accounted for most of the drawdowns during 2014 (probably due to the ‘2014 oil price shock’). Arbitrage, Event Driven, and Bottom-Up strategies seem to consistently be contributing minimal drawdowns since 2000.
Where would I find protection in 2018? If your investment goal is to minimise drawdown in 2018 then adding Hedge Funds that specialise in the Arbitrage strategy to your portfolio would have been beneficial. Moving away from an equity to a fixed income strategy may have provided insulation from a historically bad year for hedge funds. After a turbulent year for fixed income securities the outlook for 2019 is divided; although this may provide opportunity for some managers.
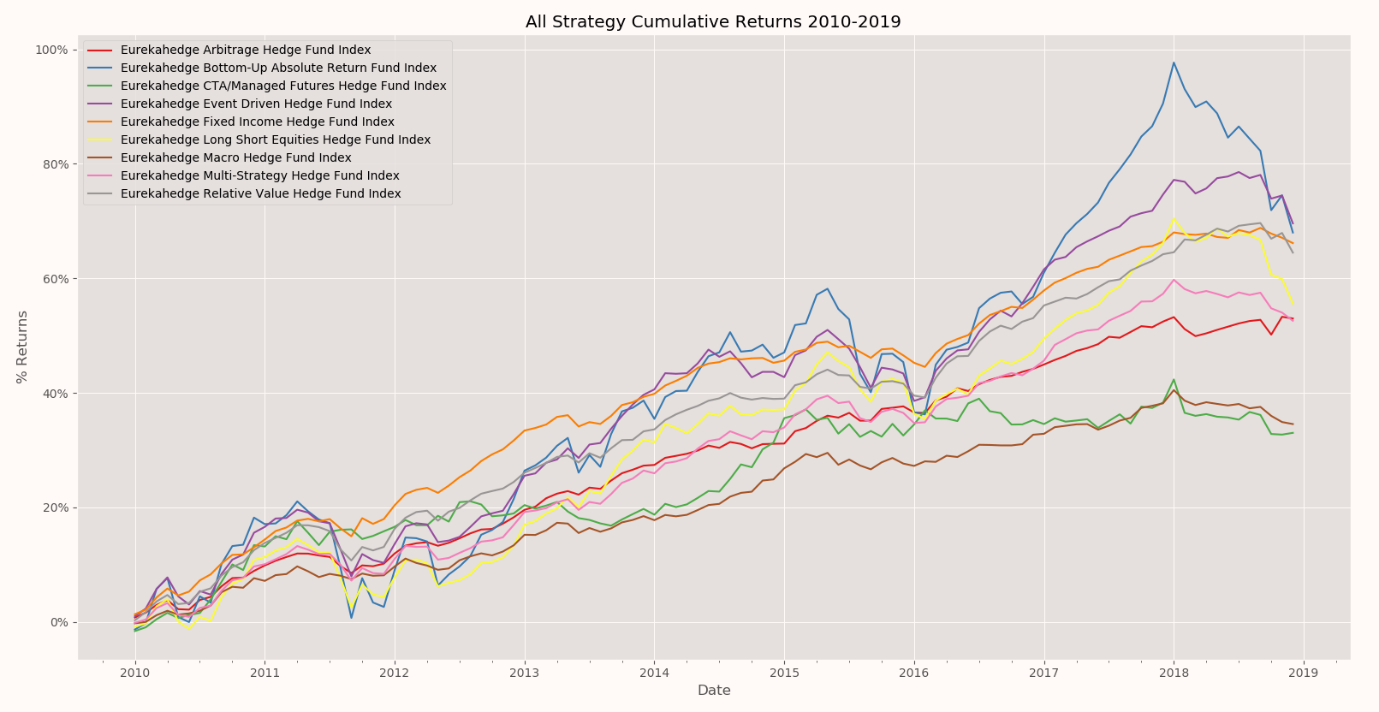
Figure 2: All Strategy Cumulative Returns 2010-2019. Data provided by Eurekahedge.
Figure 2 shows cumulative monthly returns for each strategy since January 2010 until the end of December 2018. It shows how the past 24 months have been difficult for most strategies with both Fixed Income and Arbitrage being relatively insulated from the turmoil. The most noticeable dip in cumulative returns seem to be Bottom-up, Event Driven, and Long Short Equities. These cumulative returns may explain why the relative AUM share for Event Driven and Long Short Equity has decreased over time and why there has been such a relative increase in appetite for Fixed Income hedge funds. However, it fails to explain why we have seen a relative reduction in Arbitrage AUM.
In conclusion, we can see that 2018 was quite a dramatic year for most hedge fund strategies. With reductions in AUM, and large dips in cumulative returns across most strategies. Based on the results of this study fixed income and arbitrage strategies seem to have weathered the storm to date but it will be interesting to see how these strategies perform Q1 2019 and see if the behaviour continues across all strategies and so, we will post an update on these statistics at the end of Q1 2019.
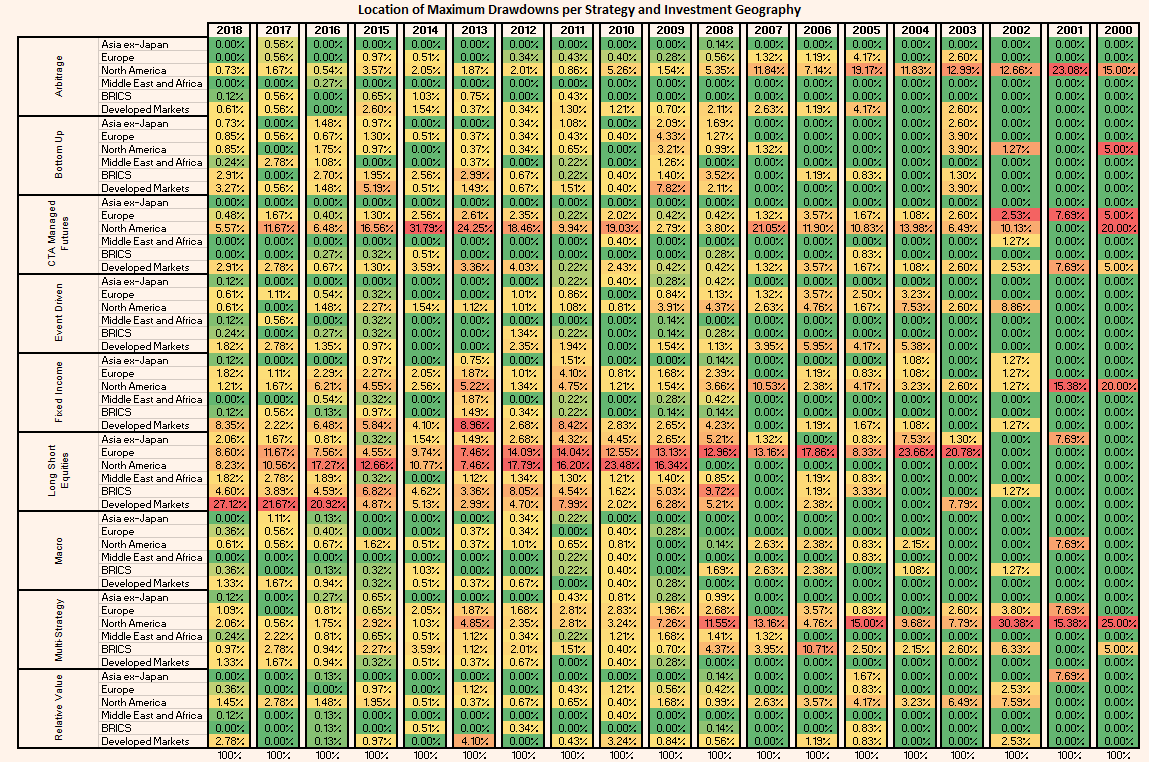
Table 2: Maximum Drawdowns per year by Strategy and Investment Geography. Data provided by Eurekahedge.
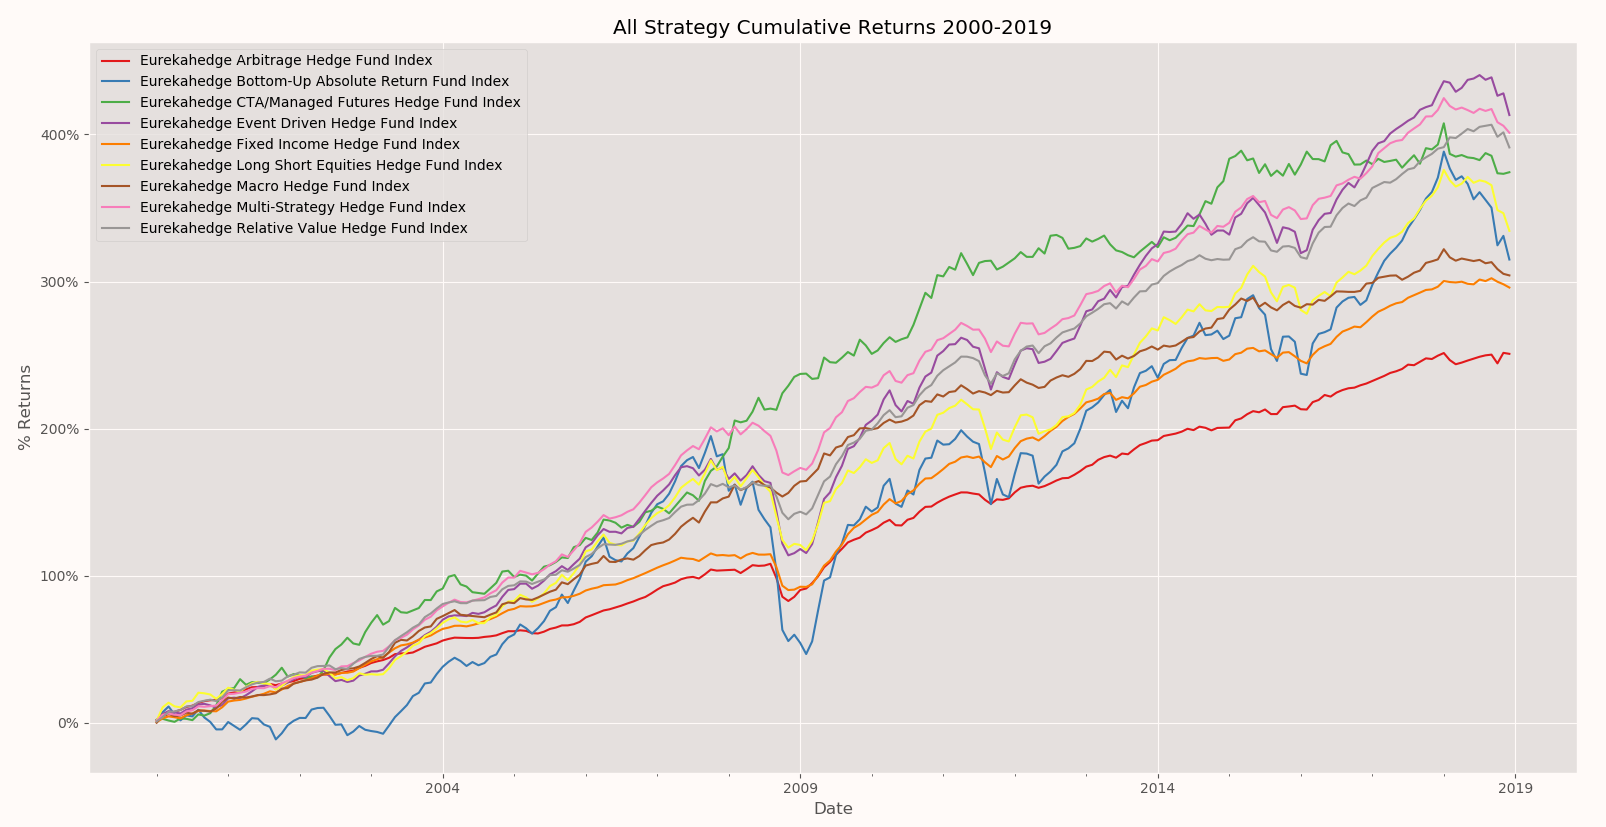
Figure 3: All Strategy Cumulative Returns 2010-2019.
Data provided by Eurekahedge.

71 Carter Lane, London,
EC4V 5EQ
+44 20 7510 2003